A huge number of analyses can be performed with the various public CQ WW logs (cq-ww-2005--2021-augmented.xz; see here for details of the augmented format) for the period from 2005 to 2021.
As in prior years, there follow a few basic
analyses that interest me. There is, of course, plenty of scope to use
the log files for further analyses, some of which are suggested by the figures below.
Below are some simple analyses of
basic statistics from the logs. The 2021 versions of the contests were,
of course, run under the circumstance of the world-wide pandemic, rather similar to the contests in 2020.
So we can expect the data for 2021 to be unlike those for any other
year except, possibly, 2020. Whether 2020 and 2021 presage changes in any long-term trends will take another a year or two
to become clear.
Number of Logs
Until 2020, the raw number of submitted logs for SSB had been relatively flat for
several years; the logs submitted for CW showed a fairly
steady annual increase. In 2020, unsurprisingly, the number of logs in both modes increased to new records; CQ WW SSB 2021 set another record; on CW, the number of logs decreased slightly, but would still have been a record were it not for 2020 :

One
not infrequently reads statements to the effect that the popularity
of contests such as CQ WW has long been increasing. This plot suggests
that this had not been true for a number of years prior to 2020 (and
even when it was
true, there are alternative explanations for the year-on-year increase,
such as increasing ease of electronic log submission). For the past two years,
because of the circumstances of a worldwide pandemic, one would reasonably expect that
there really were more people sitting at home and spending at least a
portion of the weekend(s) on the air. But, as we see in the next
section, that doesn't really seem to have been the case.
Popularity
By definition, popularity requires some measure of people (or, in our case, the simple proxy of callsigns) -- there is no reason to believe, a priori, that the number of received logs as shown above is related in any particular way to the popularity of a contest, despite non-infrequent conclusory statements to the contrary.
So we look at the number of calls in
the logs as a function of time, rather than positing any kind of
well-defined positively correlated relationship between log submission
and popularity (actually, the posts I have seen don't even bother to
posit such a relationship: they are silent on the matter, thereby simply
seeming to presume that the reader will assume one).
However, the situation isn't as
simple as it might be, because of the presence of busted calls in logs.
If a call appears in the logs just once (or some small number of times),
it is more likely to be a bust rather an actual participant. Where to
set a cut-off a priori in order to discriminate between busts and
actual calls is unclear; but we can plot the results of choosing
several such values.
First, for SSB:

Regardless of how many logs a call
has to appear in before we regard it as a legitimate callsign, the
popularity of CQ WW SSB since the start of the pandemic has surely increased from the doldrums of the prior few years. Whether this contest is more
popular than it was at a similar point in the last solar cycle is unclear, but it does seem to have held its own.
[I note that a reasonable argument
can be made that the number of uniques will be more or less proportional
to the number of QSOs made (I have not tested that hypothesis; I leave
it as an exercise for the interested reader to determine whether it is
true), but there is no obvious reason why the same would be true for,
for example, callsigns that appear in, say, ten or more logs.]
Moving to CW:
Apart from the uptick in 2020, presumably due to the novelty on being forced to remain at home during the pandemic, participation in the CW event seems
to be more or less the same as at the corresponding point in the last
cycle.
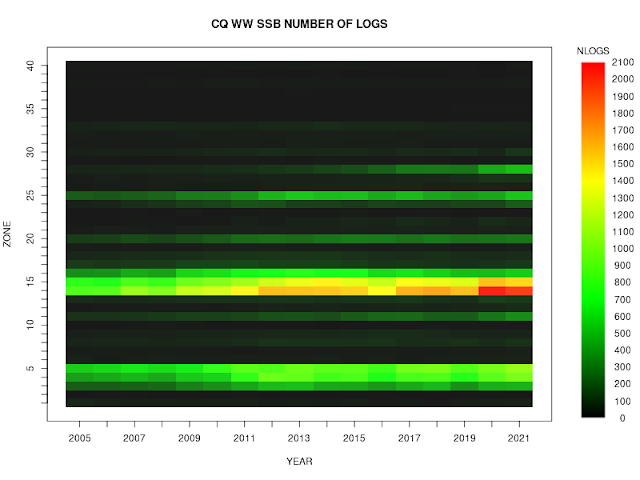
Geographical Participation
How has the geographical distribution of entries changed over time?
Again looking at SSB first:
Zone 28 continues to show an increase in the number of logs submitted, to the point where it is now not dissimilar to the number from zone 25. Still, the number of
logs from
zones outside EU or the US continues to be very small.
This can be seen more clearly if we plot the
percentage of logs received from each zone as a function of time:
2020
shows a clear increase in western Europe -- the place that already
dominated the submissions -- presumably because of the pandemic, and a
continuation in Indonesia of the increase that has been ongoing for a
number of years now. Of course, this came at the cost of a decrease in
other areas, particularly, it seems, Japan. 2021 seems to show that 2020 was an aberration, and, apart from the increase in entrants from zone 28, the geographical areas with the most entrants seem more or less the same as in pre-pandemic years.
On CW, most zones evidence a sustained long-term increase:
And the relative increase seems to
be spread more or less evenly across all zones, with the percentages of
logs from each zone barely changing over the years 2005 to 2021
(although again what increase there is seems to be most pronounced in
western Europe):
It is, I think, of some interest that the change in participation in zone 28 that is obvious on SSB is essentially absent on CW.
Activity
Total activity in a contest depends
both on the number of people who participate and on how many QSOs each
of those people makes. We can use the public logs to count the total
number of distinct QSOs in the logs (that is, each QSO is counted only once, even if both participants have submitted a log).
For SSB:
The
total number of distinct QSOs is
essentially the same as at the same point in the last solar cycle.
And for CW:
On
this mode there continues to be, it seems, a long-lived underlying upward trend (on which
the effect of the solar cycle is superimposed), perhaps augmented somewhat by the pandemic in 2020 (but not in 2021 for some reason). Despite the claims I
see that CW is an obsolete technology in serious decline, the actual
evidence, at least from this, the largest contest of the year, continues to be quite
the opposite. (This is a good reminder that when someone makes a claim
whose truth is not self-evident, one should examine the underlying data
for oneself. I have found that all too often it transpires that no
defensible evidence has been put forward for the conclusion being
drawn.) The evidence certainly seems to indicate that CW activity is healthy, at least insofar as CQ WW is
concerned.
It is worth noting that, during the 2021 running of the SSB contest, it is quite clear that cycle 25 had an impact, whereas a month later on CW conditions had returned to the doldrums.
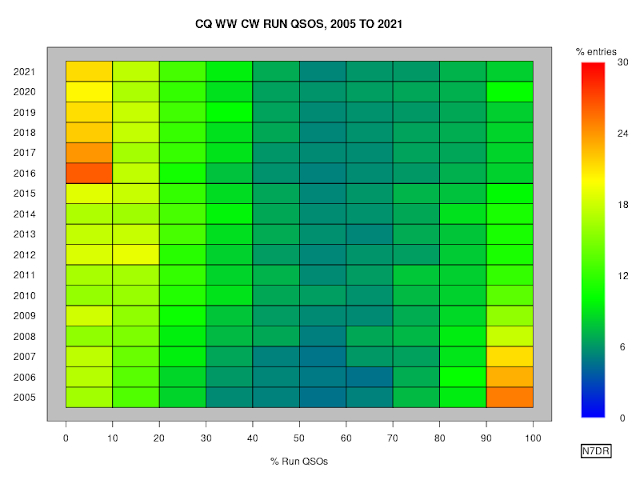
Running and Calling
On SSB, the ongoing gradual shift towards stations strongly favouring
either running or calling, rather than splitting their effort between
the two types of operation, finally appears to have reached some kind of
equilibrium, with essentially no change between 2018 and 2019, and even a slight reversal of the trend in 2020 and 2021:


I have not investigated the cause of the decrease in the
percentage of stations strongly favouring running, although the public
logs could readily be used to distinguish possibilities that spring to
mind, such as more SO2R operation, more multi-operator stations, and/or a
reluctance of stations to forego the perceived advantages of spots from
cluster networks.
On CW, the split between callers and runners continues to be much less
bimodal than on SSB (on SSB, fully 30% of entrants have no
run QSOs; on CW, the equivalent number is below 10%). Indeed, the
difference in call/run behaviour on the two modes (and the difference in
the way that the behaviour has changed over time) is profound, and
probably worthy of further investigation. CW continues to appear to have
what would seem to be a much healthier split between the two operating
styles:
Assisted and Unassisted
We can see how the relative popularity of the assisted and unassisted categories has changed since they were introduced:
On CW, there are essentially equal numbers of assisted and unassisted
logs, while on SSB the unassisted logs handily exceeds the number of
assisted logs. My guess, for what it's worth, is that CW assistance is
more widespread partly because it (partially) absolves stations from
actually being able to copy at high speed, and partly because the RBN is
so effective that essentially all CQing stations are spotted.
I find it particularly interesting that the number of CWU logs has
remained essentially unchanged ever since the unassisted category was
created.
Looking at the number of QSOs appearing in the unassisted and assisted logs:
(The lines are for the median number of logs; the vertical bars run from
10% to 90%, 20% to 80%, 30% to 70%, 40% to 80%, with opacity increasing
in that order.)
A long-term downward trend in the numbers of QSOs in the assisted logs
ceased in 2016, and since then the median number of QSOs in the
assisted logs has remained essentially unchanged. A more or less
constant difference of roughly one hundred QSOs between
the median CW and SSB logs (in favour of CW) continues.
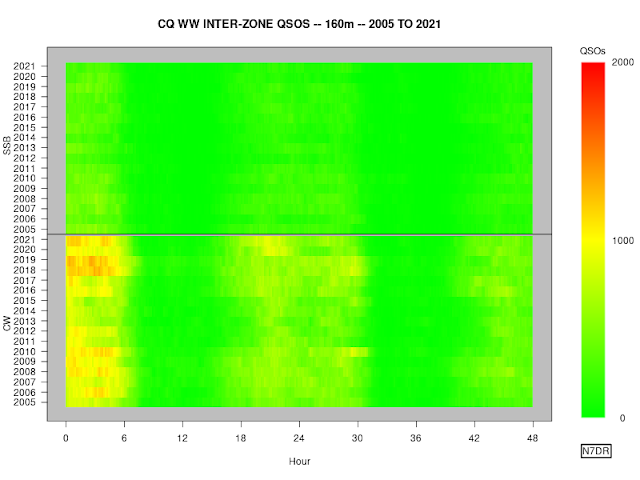
Inter-Zone QSOs
We can show the number of inter-zone
QSOs, both band-by-band and in total. In these plots, the number of QSOs
is accumulated every ten minutes, so there are six points per hour.
As expected at this point in the cycle, there were a negligible number of QSOs on 10m in the CW event, although there were some on SSB (as is reflected above, in the Activity section). The CW event suffers by a month later in the year. [I do not understand why the CQ WW committee do not alternate the weekends of the SSB and CW modes; but then, I don't understand a lot of what they do or don't do.]
It is clear that in 2021 15m was outstanding for the first day of the SSB event. There were many fewer QSOs on the second day, perhaps at least partly in response to the propagation on 10m, which allowed at least some QSOs on the second day. For the CW contest, it is clear that 2021 simply had poorer conditions than 2020. 2022 is presumably likely to see a return to good conditions on 15m for the CW event; at least one hopes so.
20m was more or less a repetition of 2020 on both modes.
As
usual, CW dominates on 40m The first few hours, which generally dominate the activity for the weekend, in 2021 saw only somewhat more activity than the other two active periods (which correspond to evening in Europe).
80m was also dominated by CW, with, as usual, the bulk of DX activity in the first six hours; indeed, there was relatively little activity at all in the second day of the contest.
160m
paints a similar story to 80m, although the raw QSO counts are much
lower and the second day is almost devoid of QSOs.
The overall picture shows the influence of the new solar cycle on SSB; but, as noted above, in 2021 CW saw a somewhat of a decrease in inter-zone QSOs as compared to 2020.