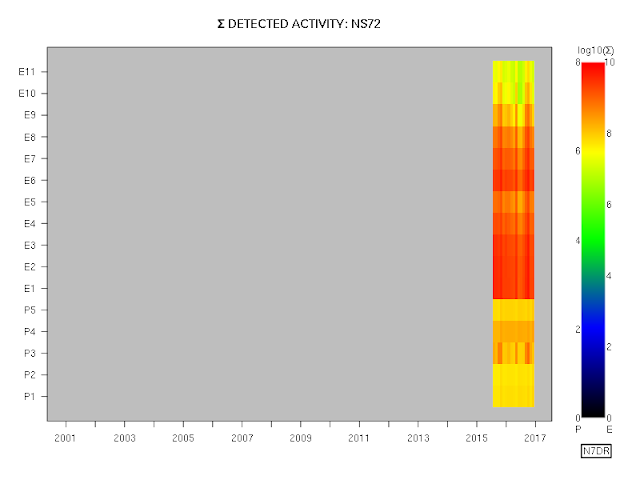
So here is the information I have been able to gather so far regarding the channels of the CXD instrument. Thank to John Sullivan of LANL for this information.
I note that there are minor inconsistencies in the publicly available documentation. These inconsistencies, however, would seem likely to be less than the accuracy and reproducibility limits for the instrumentation. What follows is my best interpretation of the information I have been able to gather.
This paper and this paper provide nominal energy ranges for the 11 electron channels. Adding the equivalent values of γ to that information gives us this table:
| CXD Electron Channel Energy Ranges (MeV) | |||||
|---|---|---|---|---|---|
| Channel | Detector | Min Energy | Min γ | Max Energy | Max γ |
| E1 | LEP | 0.14 | 1.27 | 0.23 | 1.45 |
| E2 | LEP | 0.23 | 1.45 | 0.41 | 1.80 |
| E3 | LEP | 0.41 | 1.80 | 0.77 | 2.51 |
| E4 | LEP | 0.77 | 2.51 | 1.25 | 3.45 |
| E5 | LEP | 1.26 | 3.46 | 68 | 134 |
| E6 | HEP | 1.3 | 3.54 | 1.7 | 4.33 |
| E7 | HEP | 1.7 | 4.33 | 2.2 | 5.30 |
| E8 | HEP | 2.2 | 5.30 | 3.0 | 6.87 |
| E9 | HEP | 3.0 | 6.87 | 4.1 | 9.02 |
| E10 | HEP | 4.1 | 9.02 | 5.8 | 12.35 |
| E11 | HEP | 5.8 | 12.35 | ||
There are two distinct detectors on the instrument, the low-energy detector (often denoted "LEP") and the high-energy detector ("HEP"). As shown above, electron channels 1 to 5 are from the LEP, channels 6 to 11 are from the HEP.
The LEP and HEP detectors respond to both electrons and protons (and photons, which we will ignore for now). For protons the LEP detector has two channels, with threshold energies of "about" 6 MeV and 10 MeV, with an upper limit of 70 MeV. This paper gives the complete ranges for the proton channels as:
| CXD Proton Channel Energy Ranges (MeV) | |||||
|---|---|---|---|---|---|
| Channel | Detector | Minimum Energy | Min γ | Maximum Energy | Max γ |
| P1 | LEP | 6 | 1.01 | 10 | 1.01 |
| P2 | LEP | 10 | 1.01 | 50 | 1.05 |
| P3 | HEP | 16 | 1.02 | 128 | 1.14 |
| P4 | HEP | 57 | 1.06 | 75 | 1.08 |
| P5 | HEP | 75 | 1.08 | ||
I am informed that the lower limits in these tables are reasonably accurate; however, the upper limits are rather soft, as the channels typically have some response to particles of higher energies.
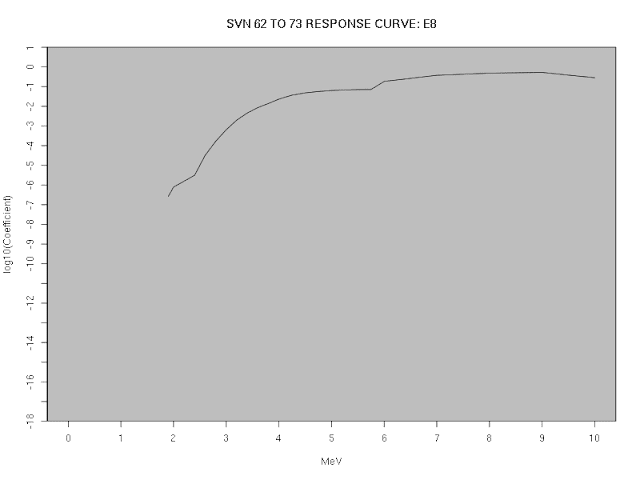
The detailed transfer function between actual particle energy and the measured flux values is currently available only for the eleven electron channels (i.e., not the proton channels), and only for the satellites carrying the CXD instrument. There are two sets of transfer functions, one for SVN 53 through 61, and one for SVN 62 through 73. The two sets of numerical coefficients that define the transfer functions are available in a spreadsheet file in OpenDocument format here (the coefficients for SVN 53 to 61 are on the first sheet, the coefficients for the remaining satellites on the second).
Plotting the transfer functions graphically, as below, gives us a better feel for the responses in the various channels.
In the same way, we can plot the response curves for the remaining satellites:
These curves are a far cry from the ideal curves of a perfect instrument: in particular, note that all channels, even the low-energy ones, have a larger response to high energy electrons than to low energy ones: the chief difference between the high-energy channels and the low-energy ones being that the high-energy channels effectively suppress any response to low-energy electrons.
Thus, a notional stream of high-energy particles would be detected by all channels. In a more realistic stream with a low-energy component, the high-energy component might well swamp the contribution from the low-energy particles, even in the (notionally) low-energy channels; but the high-energy components could be determined from the high-energy channels (which are effectively immune to contamination from low-energy electrons), and then removed prior to the analysis of the low-energy channels.
Obtaining actual flux values from the instrument is therefore not a trivial task, and will be examined in more detail in a subsequent post.


