A huge number of analyses can be performed with the various public CQ WW logs (cq-ww-2005--2020-augmented.xz; see here for details of the augmented format) for the period from 2005 to 2020.
As usual, there follow a few analyses that interest me. There is, of course, plenty of scope to use the files for further analyses.
Below are some simple zone-based analyses from the logs.
Zones and Distance
As in prior years, we can examine the distribution of distance for QSOs as a function of zone.
Below is a series of figures showing this distribution integrated over all bands and, separately, band by band for the CQ WW SSB and CQ WW CW contests for 2020.
Each
plot shows a colour-coded distribution of the distance of QSOs for each
zone, with the data for SSB appearing above the data for CW within each
zone.
For every half-QSO in a given zone, the distance
of the QSO is calculated; in ths way, the total number of half-QSOs in
bins of width 500 km is accumulated. Once all the QSOs for a particular
contest have been binned in this manner, the distribution for each zone
is normalised to total 100% and the result coded by colour and plotted.
The mean distance for each zone and mode is denoted by a small white
rectangle added to the underlying distance distribution.
Only QSOs for which logs have been provided by both parties, and
which show no bust of either callsign or zone number are included. Bins
coloured black are those for which no QSOs are present at the relevant
distance.
The
resulting plots are reproduced below. I find that they display in a
compact format a wealth of data that is informative and often
unexpected.


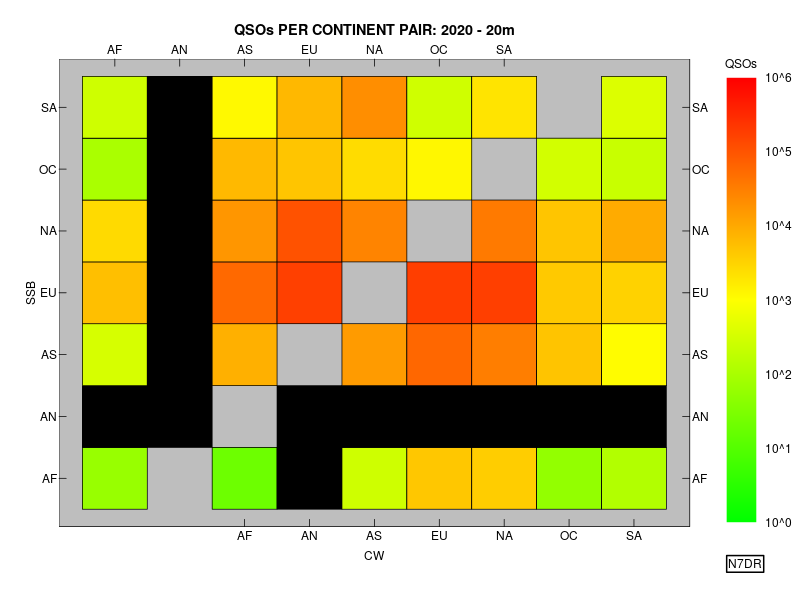
Zone Pairs
As in
prior years, We can examine the number of QSOs for pairs of zones from the 2020 contests using the augmented file.
The procedure is simple. We consider only QSOs that meet the following criteria:
- marked as "two-way" QSOs (i.e., both parties submitted a log containing the QSO);
- no callsign or zone is bust by either party.
A counter is maintained for every pair of zones (i.e.,
1-1, 1-2, 1-3 ... 40-39, 40-40) and the pertinent counter is incremented
once for each distinct QSO between stations in those zones.
Separate
figures are provided for each band, led by a figure integrating
QSOs on all bands. The figures are constructed in such a way as to show
the results for both the SSB and CW contests on a single figure. (Any zone
pair with no QSOs that meet the above criteria appears in black on the
figures.)
It is clear from these figures, as from those
for earlier years, that CQ
WW is principally a contest for intra-EU QSOs, and secondarily one for
QSOs between EU and the East Coast of North America. This format is
undoubtedly popular, as CQ WW, in
both its SSB and CW incarnations, would seem by any reasonable measure to be the
most popular contest of the year. But one does wonder whether there
isn't some other format that would strongly encourage participation from
other parts of the world, instead of concentrating on these limited
areas.


Non-Zero Zone Pairs
The activity between pairs of zones in the CW and SSB CQ WW contests
over the period from 2005 to 2020 may be usefully summarised in a single
figure:
There are 820 possible zone pairs: (z1, z1), (z1, z2) ... (z1, z40),
(z2, z2), (z2, z3) ... (z39, z39), (z39, z40), (z40, z40). The above
figure shows the number of different zone pairs actually present in the
public logs, for each mode and for each year for which data are
available, separated on a band-by-band basis and presented in the form
of percentages of the maximum possible count (
i.e., 820).
The top two lines require some additional explication: the line marked
"MEAN" is the arithmetic mean of the results for the six separate bands
for the relevant year and mode. The line marked "ANY" is also
constructed from the data for the individual bands, but such that any
give zone pair need be present on any one (or more, of course) of the
individual bands to be included on the "ANY" line.
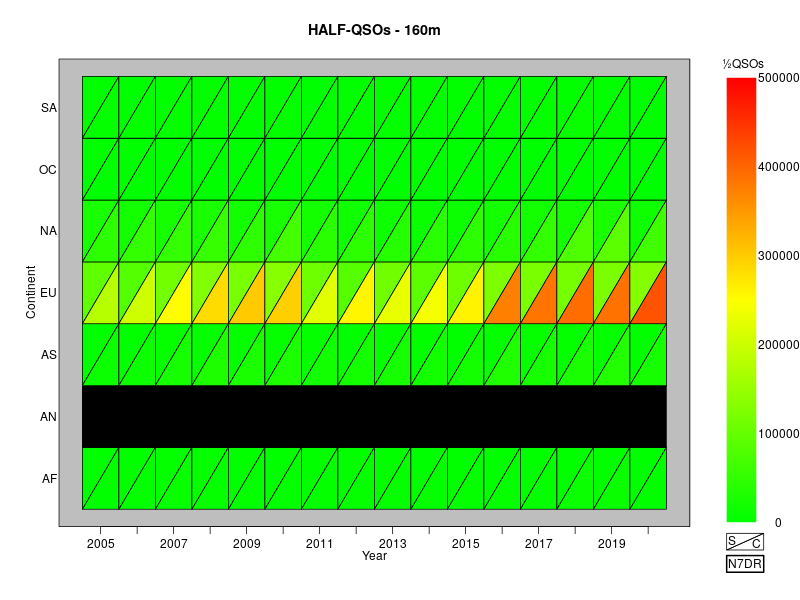
Half-QSOs Per Zone for CQ WW CW and SSB, 2005 to 2019
A simple way to display the activity in the CQ WW contests
is to count the number of half-QSOs in each zone. Each valid QSO
requires the exchange of two zones, so we simply count the total number
of times that each zone appears, making sure to include each valid QSO
only once.
If we do this for the entire contest without taking the individual bands into account, we obtain this figure:
The plot shows data for both SSB and CW contests over the period from 2005 to 2020. As in
earlier posts,
I include only QSOs for which both parties submitted a log and neither
party bust either the zone or the call of the other party. The black
triangles represent contests in which no half-QSOs were made from (or
to) a particular zone. By far the most striking feature of this plot is
the way in which activity in EU overwhelms that in the rest of the world.
We can, of course, generate equivalent plots on a band-by-band basis:
The activity from zones 14, 15 and 16 so overwhelms these figures that
in order to get a feel for the activity elsewhere, we need to move to a
logarithmic scale:
The figures speak for themselves.