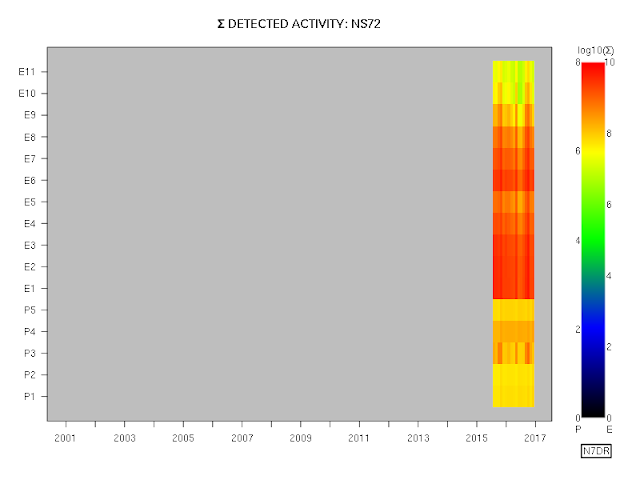
The following plots show the same information as the prior post, but with the electron and proton colour gradients scaled independently for each type of particle and each spacecraft, as well as a larger number of plottable colours, so as to provide more visible detail.
As a reminder, the plotted data are raw, taken directly from the stage 35 public dataset, with no attempt to make any corrections or calibrations.
The electron data appear much more consistent from satellite to satellite on this time scale than the proton data. Also, it is clear that some channels are more or less "sensitive" than their neighbouring channels, insofar as the raw counts reported in the dataset are concerned. Presumably, once proper calibration has been performed, the latter phenomenon will no longer be apparent.


No comments:
Post a Comment
Note: Only a member of this blog may post a comment.