Here is a table of the twenty fixed-frequency stations most often posted by the RBN in 2021:
| Position | Station | Frequency (kHz) | Number of Posts |
|---|---|---|---|
| 1 | OK1CF |
1826 | 142,854 |
| 2 | CS3B |
14100 | 133,798 |
| 3 | YV5B |
14100 |
114,184 |
| 4 | OH2B |
14100 |
95,011 |
| 5 | W6WX | 14100 |
90,524 |
| 6 | I1MMR |
7026 |
74,540 |
| 7 | 4U1UN |
14100 | 68,877 |
| 8 | HB4FV/B |
10134 |
62,834 |
| 9 | DL8LAS | 1831 |
60,296 |
| 10 | 4X6TU | 14100 |
58,076 |
| 11 | LY2PX | 14027 |
51,797 |
| 12 | 4X6TU | 18110 |
50,886 |
| 13 | IZ3DVW/B | 10132 |
50,431 |
| 14 | YV5B | 18110 |
49,640 |
| 15 | W6WX | 18110 |
46,905 |
| 16 | AA1K | 1821 |
46,591 |
| 17 | SP3CW | 3565 |
45,686 |
| 18 | LZ1QI | 7006 |
45,424 |
| 19 | CS3B | 18110 |
45,152 |
| 20 | LZ1QI |
7004 |
44,457 |
Notes:
- Frequencies are rounded to the nearest kHz;
- I am unsure how the U.S. stations in the list can be legal, since the FCC's regulations appear to limit [unattended] HF beacons to a portion of 10m;
- It is my memory that the original HF beacons were all located on 28 MHz, so that listeners could be made aware of an opening. It is noticeable that not a single one of the stations on the list above is on 10m: the vast majority are on bands that can reasonably be expected to support some kind of non-local propagation at almost all times (which is probably the very reason that they are posted by the RBN so often -- but one does wonder what the putative purpose of such a beacon is).
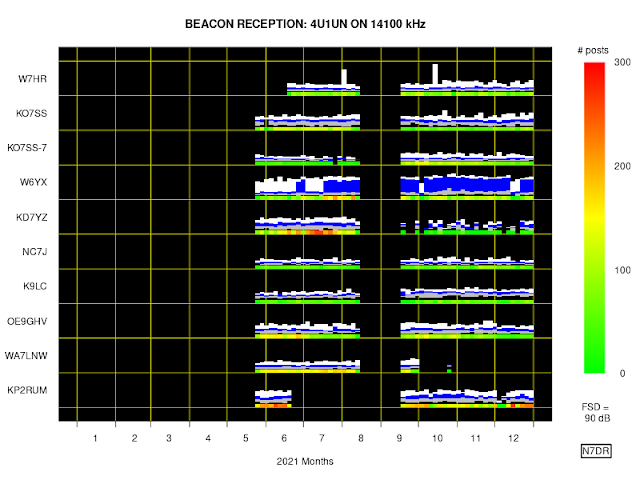
Below are figures showing, for each of the stations in the table
above, the signal strength as reported by the ten RBN stations that
most frequently posted each individual beacon station.
In the following figures:
- The ordinate for each of the strip charts ranges between 0 dB and the value shown as FSD (i.e., full scale deflection) near the bottom right-hand corner; in this case, the maximum value of each strip is therefore 80 dB.
- The value plotted in this manner is the value denoted SNR by the RBN. Remember that the RBN has an odd definition of SNR.
- The abscissa is divided into a number of bins of equal duration. On each plot there are 100 such bins; because the duration covered by each plot is one year, each bin therefore covers about 3½ days.
- At the bottom of each strip chart is a coloured bar. Each bin in these bars is coloured so as to represent the total number of times that the RBN station spotted the beacon in the period covered by the bin.The colour legend for each figure is to the right of the figure.
- For the period covered by each 3½-day bin, the lower quartile of SNR readings is coloured grey, the upper quartile is coloured white, and the middle two quartiles are coloured blue.
- The vertical order of the various RBN stations is determined solely by the chronological order in which each station first spotted the beacon.


No comments:
Post a Comment
Note: Only a member of this blog may post a comment.