Prior posts in this series:
In this post I list the stations with the lowest probabilities of busting a call in CQ WW CW from 2005 to 2016, using the procedure developed in the second post above. This is the same methodology as was used in the third post.
| 2005 CQ WW CW -- weighted mean values of $p_{bust}$ |
|---|
| Position |
Call |
weighted mean |
$Q_v$ |
$B$ |
| 1 |
LZ9R |
0.0008 |
1210 |
0 |
| 2 |
HI3/SP9XCN |
0.0008 |
2403 |
1 |
| 3 |
K1TO |
0.0010 |
992 |
0 |
| 4 |
OK1FDR |
0.0011 |
888 |
0 |
| 5 |
W5MX |
0.0012 |
826 |
0 |
| 6 |
DK1MAX |
0.0013 |
717 |
0 |
| 7 |
OK1JOC |
0.0014 | 701 |
1 |
| 8 |
DL6KVA |
0.0014 |
698 |
0 |
| 9 |
OM8ON |
0.0014 |
693 |
0 |
| 10 |
DF1DX |
0.0015 |
656 |
0 |
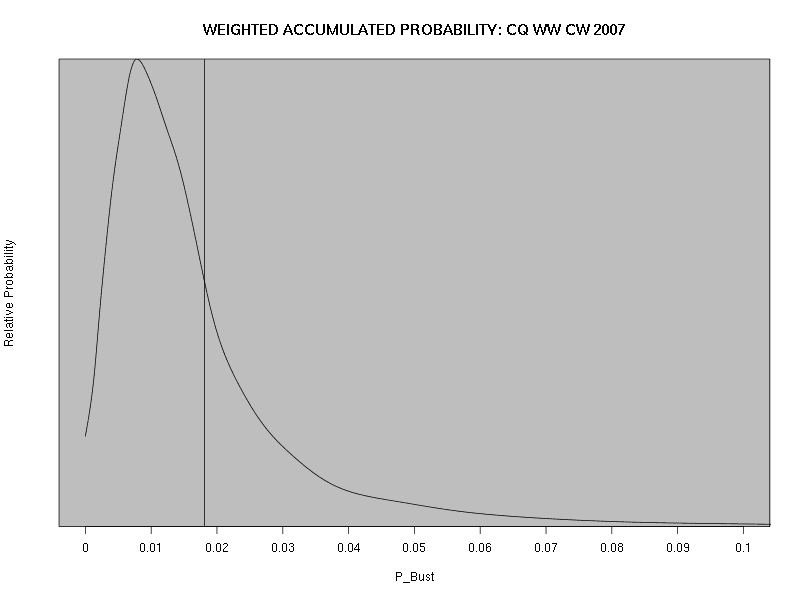
As with SSB, we plot the aggregated probability function for $p_{bust}$, weighted by the number of verified QSOs, $Q_v$, for all stations:
As before, the location of the vertical line represents the weighted mean of the probability curve.
| 2006 CQ WW CW -- weighted mean values of $p_{bust}$ |
|---|
| Position |
Call |
weighted mean |
$Q_v$ |
$B$ |
| 1 |
DL5KUT |
0.0007 |
1288 |
0 |
| 2 |
LY2MM |
0.0008 |
1223 |
0 |
| 3 |
I2WIJ |
0.0009 |
1091 |
0 |
| 4 |
OH8X |
0.0009 |
2235 |
1 |
| 5 |
DL8DYL |
0.0010 |
982 |
0 |
| 6 |
9A3GI |
0.0010 |
953 |
0 |
| 7 |
HB9ARF |
0.0012 | 802 |
0 |
| 8 |
WE9V |
0.0013 |
747 |
0 |
| 9 |
K1HT |
0.0014 |
710 |
0 |
| 10 |
KR2Q |
0.0014 |
693 |
0 |
| 2007 CQ WW CW -- weighted mean values of $p_{bust}$ |
|---|
| Position |
Call |
weighted mean |
$Q_v$ |
$B$ |
| 1 |
SM6CNN |
0.0007 |
1267 |
0 |
| 2 |
DL8DYL |
0.0008 |
1151 |
0 |
| 3 |
SP2LNW |
0.0010 |
967 |
0 |
| 4 |
KQ3F |
0.0012 |
828 |
0 |
| 5 |
W2LE |
0.0012 |
784 |
0 |
| 6 |
TM6A |
0.0012 |
1614 |
1 |
| 7 |
N9CK |
0.0013 | 765 |
0 |
| 8 |
K8CC |
0.0013 |
763 |
0 |
| 9 |
UA1CUR |
0.0013 |
760 |
0 |
| 10 |
W1MU |
0.0013 |
744 |
0 |
| 2008 CQ WW CW -- weighted mean values of $p_{bust}$ |
|---|
| Position |
Call |
weighted mean |
$Q_v$ |
$B$ |
| 1 |
S56A |
0.0007 |
1368 |
0 |
| 2 |
K6NA |
0.0010 |
997 |
0 |
| 3 |
HA8FW |
0.0011 |
900 |
0 |
| 4 |
DL1RG |
0.0012 |
785 |
0 |
| 5 |
N9CK |
0.0012 |
772 |
0 |
| 6 |
LY3BG |
0.0014 |
684 |
0 |
| 7 |
K5ZD |
0.0014 | 2827 |
3 |
| 8 |
PA0JNH |
0.0015 |
640 |
0 |
| 9 |
JS3CTQ |
0.0015 |
631 |
0 |
| 10 |
OK1JOC |
0.0016 |
1287 |
1 |
| 2009 CQ WW CW -- weighted mean values of $p_{bust}$ |
|---|
| Position |
Call |
weighted mean |
$Q_v$ |
$B$ |
| 1 |
N4BP |
0.0008 |
1229 |
0 |
| 2 |
LZ2SX |
0.0008 |
1135 |
0 |
| 3 |
K1ZZ |
0.0009 |
1009 |
0 |
| 4 |
W3OA |
0.0010 |
988 |
0 |
| 5 |
OM0WR |
0.0010 |
923 |
0 |
| 6 |
OK2BUT |
0.0012 |
791 |
0 |
| 7 |
EY8MM |
0.0013 | 735 |
0 |
| 8 |
JP1QDH |
0.0013 |
729 |
0 |
| 9 |
SM0Q |
0.0014 |
709 |
0 |
| 10 |
KR2Q |
0.0014 |
702 |
0 |
| 2010 CQ WW CW -- weighted mean values of $p_{bust}$ |
|---|
| Position |
Call |
weighted mean |
$Q_v$ |
$B$ |
| 1 |
YT2AAA |
0.0007 |
1418 |
0 |
| 2 |
N2GC |
0.0008 |
1200 |
0 |
| 3 |
SP9NSV |
0.0008 |
1188 |
0 |
| 4 |
OK7T |
0.0010 |
969 |
0 |
| 5 |
RZ3VO |
0.0011 |
892 |
0 |
| 6 |
W6OAT |
0.0012 |
806 |
0 |
| 7 |
VA7RN |
0.0012 | 771 |
0 |
| 8 |
OH8FKU |
0.0013 |
741 |
0 |
| 9 |
OH6MW |
0.0013 |
2267 |
2 |
| 10 |
G4HZV |
0.0014 |
683 |
0 |
| 2011 CQ WW CW -- weighted mean values of $p_{bust}$ |
|---|
| Position |
Call |
weighted mean |
$Q_v$ |
$B$ |
| 1 |
LZ2SX |
0.0007 |
1296 |
0 |
| 2 |
OR2F |
0.0007 |
1293 |
0 |
| 3 |
W1ZT |
0.0007 |
1266 |
0 |
| 4 |
W3OA |
0.0008 |
1212 |
0 |
| 5 |
RN1ON |
0.0008 |
1134 |
0 |
| 6 |
LZ9R |
0.0008 |
2407 |
1 |
| 7 |
RG5A |
0.0009 | 1080 |
0 |
| 8 |
UN9GD |
0.0009 |
1079 |
0 |
| 9 |
US2IZ |
0.0009 |
1050 |
0 |
| 10 |
DL1DVE |
0.0010 |
951 |
0 |
| 2012 CQ WW CW -- weighted mean values of $p_{bust}$ |
|---|
| Position |
Call |
weighted mean |
$Q_v$ |
$B$ |
| 1 |
HB9ARF |
0.0006 |
1601 |
0 |
| 2 |
JI1RXQ |
0.0006 |
1514 |
0 |
| 3 |
DJ1YFK |
0.0007 |
1266 |
0 |
| 4 |
DL4FN |
0.0008 |
1166 |
0 |
| 5 |
SM6FKF |
0.0009 |
1069 |
0 |
| 6 |
ES1WST |
0.0009 |
1040 |
0 |
| 7 |
AD1C |
0.0010 | 984 |
0 |
| 8 |
SM6CNN |
0.0010 |
976 |
0 |
| 9 |
LY3CY |
0.0011 |
895 |
0 |
| 10 |
SM5CIL |
0.0011 |
887 |
0 |
| 2013 CQ WW CW -- weighted mean values of $p_{bust}$ |
|---|
| Position |
Call |
weighted mean |
$Q_v$ |
$B$ |
| 1 |
K1TO |
0.0006 |
1569 |
0 |
| 2 |
VX7SZ |
0.0006 |
1491 |
0 |
| 3 |
LY2NY |
0.0006 |
1439 |
0 |
| 4 |
W2LE |
0.0007 |
1369 |
0 |
| 5 |
IK8UND |
0.0007 |
1297 |
0 |
| 6 |
UA3MIF |
0.0009 |
1037 |
0 |
| 7 |
LY3CY |
0.0010 | 985 |
0 |
| 8 |
N0BK |
0.0010 |
955 |
0 |
| 9 |
OM0WR |
0.0010 |
949 |
0 |
| 10 |
AA7V |
0.0011 |
900 |
0 |
| 2014 CQ WW CW -- weighted mean values of $p_{bust}$ |
|---|
| Position |
Call |
weighted mean |
$Q_v$ |
$B$ |
| 1 |
S54X |
0.0005 |
2005 |
0 |
| 2 |
KM3T |
0.0005 |
1829 |
0 |
| 3 |
5H3EE |
0.0006 |
1637 |
0 |
| 4 |
S56A |
0.0006 |
1622 |
0 |
| 5 |
OH6MW |
0.0007 |
3024 |
1 |
| 6 |
YT2AAA |
0.0007 |
1376 |
0 |
| 7 |
AD1C |
0.0007 | 1337 |
0 |
| 8 |
UW1WU |
0.0007 |
1317 |
0 |
| 9 |
K2MK |
0.0007 |
1302 |
0 |
| 10 |
M6W |
0.0009 |
2267 |
1 |
| 2015 CQ WW CW -- weighted mean values of $p_{bust}$ |
|---|
| Position |
Call |
weighted mean |
$Q_v$ |
$B$ |
| 1 |
K6LL |
0.0005 |
1922 |
0 |
| 2 |
LZ9R |
0.0007 |
2833 |
1 |
| 3 |
K7UA |
0.0007 |
1254 |
0 |
| 4 |
JI1RXQ |
0.0008 |
1219 |
0 |
| 5 |
DH0GHU |
0.0008 |
1216 |
0 |
| 6 |
RG5A |
0.0008 |
1127 |
0 |
| 7 |
OM0WR |
0.0008 | 1119 |
0 |
| 8 |
RX1A |
0.0009 |
1099 |
0 |
| 9 |
RD9CX |
0.0009 |
1093 |
0 |
| 10 |
RW5CW |
0.0009 |
1071 |
0 |
| 2016 CQ WW CW -- weighted mean values of $p_{bust}$ |
|---|
| Position |
Call |
weighted mean |
$Q_v$ |
$B$ |
| 1 |
LY5W |
0.0005 |
1850 |
0 |
| 2 |
KE3X |
0.0006 |
1633 |
0 |
| 3 |
DM2M |
0.0006 |
1563 |
0 |
| 4 |
K0KX |
0.0007 |
1389 |
0 |
| 5 |
K1ZZ |
0.0008 |
2555 |
1 |
| 6 |
RX7K |
0.0009 |
1031 |
0 |
| 7 |
EW8W |
0.0009 | 1017 |
0 |
| 8 |
K2PO |
0.0010 |
977 |
0 |
| 9 |
OL4W |
0.0010 |
975 |
0 |
| 10 |
LY3CY |
0.0010 |
955 |
0 |
NB: As mentioned in the SSB analysis, it is, of course, much easier to copy a callsign correctly if one
calls stations rather than running them. Indeed, a reasonably careful station that restricts itself to calling others should never make a mistake in copying a callsign. In the above analysis, there is no attempt to distinguish which station is calling which. Therefore we will refine this analysis in a later post, restricting it to running stations.
As with SSB, one thing stands out from the above plots: the distribution function
for $p_{bust}$ across all entrants is remarkably robust. Here is a plot
of the weighted mean of $p_{bust}$ as a function of time (the CW data are red; the SSB data are superimposed in black):
Just as for SSB, the
long-term trend is for an improvement in accuracy, but the last few years seem to have stabilised around a mean
weighted probability of a bust of about 1.6%. It is clear that the bust rate for CW is persistently better by a small amount than the rate for SSB (which is perhaps a surprising result).
If you wish to perform your own analyses, a file of the CW weighted means of the $p_{bust}$
probability function for each individual station (not just the top-ten
stations listed above)
is available for the period 2005 to 2016. (You can, of course, create your own dataset(s) from the
full augmented data files.)


No comments:
Post a Comment
Note: Only a member of this blog may post a comment.