2017-01-05

Some CQ WW SSB Analyses

A huge number of analyses can be performed with the various CQ WW SSB files. There follow a few that interested me. There is plenty of scope for further analyses (some of which are suggested below).

Geographical Participation

How has the geographical distribution of entries changed over time? 


Zones 11 and 28 seem to show a slow but sustained increase in the number of logs submitted. Nevertheless, compared to the behemoths like zones 14 and 15, the number of logs from these areas is miniscule. This can be seen more clearly if we plot the percentage of logs received from each zone as a function of time:


It is also worth noting that after a lustrum or so of somewhat increased participation, zone 3 has declined perceptibly in relative participation in recent years.


Popularity

By definition, popularity requires some measure of people (or, in our case, the simple proxy of callsigns). So we can look at the number of calls in the logs as a function of time:


Regardless of how many logs a call has to appear in before we regard it as a legitimate callsign, the popularity of CQ WW SSB dropped considerably in 2016, to a level rarely (if ever) seen in the public logs.

Conditions were quite bad for the 2016 running of the contest; nevertheless, while poor conditions might reasonably be expected to have a major bearing on metrics related to the number of QSOs, it is not obvious, a priori, that it should have a substantial effect on the raw popularity as estimated by this metric. It seems that there were simply fewer stations QRV for the contest in 2016 than in earlier years.

I note that a reasonable argument can be made that the number of uniques will be more or less proportional to the number of QSOs made (I have not tested that hypothesis; I leave it as an exercise for the interested reader to determine whether it is true), but there is no obvious reason why the same would be true for, for example, callsigns that appear in, say, ten or more logs.


Activity

Total activity in a contest depends both on the number of people who participate and on how many QSOs each of those people makes. We can use the public logs to count the total number of distinct QSOs in the logs (that is, each QSO is counted only once, even if both participants have submitted a log).


As was the case for popularity, there was a precipitous decline in activity in the 2016 CQ WW SSB contest, with both 10m and 15m showing major decreases. Activity on the other bands was down slightly from the each band's peak year, but was more or less in line with activity for the past few years. The overall activity, though, was down nearly a third from 2015, a greater decline even than the decline in popularity: thus, fewer stations were active, and, on the average, the stations that were active made fewer QSOs.

Activity would be reasonably expected to be down in 2016, partly because the pool of stations to work was smaller in 2016 (i.e., the contest was less popular in that year), and partly because propagation between the stations that were active was worse.

(Everything else being equal, one might naïvely think that the number of QSOs would scale roughly as the square of the number of active stations active; however, given the highly non-random nature of the geographical distribution of stations in CQ WW and the propagation paths between stations, there is no reason to expect, a priori and without further analysis, that such a relationship would necessarily pertain. And, in any case, everything is not equal from year to year: a reasonable initial hypothesis is that the amount of activity would scale roughly as the product of the square of the number of active stations and some linear measure of the ease with which a "typical" QSO can be completed. There are, I think, sufficient data in the logs to perform a more quantitative analysis along these lines, should anyone be so inclined.)

2017-01-04

New CQ WW SSB video maps

I have updated the set of CQ WW SSB video maps on my youtube channel (channel N7DR). These video maps cover all the years for which public CQ WW SSB logs are currently available (2005 to 2016).

To access individual videos directly:

2017-01-03

CQ WW SSB 2016 logs available

The logs for the 2016 running of the CQ WW SSB contest are now available from CQ. The logs for the CW contest are not yet available.

The logs are also available in compressed form that may be more easily and quickly downloaded here.

I have created a compressed file that contains all the cleaned QSO lines from the Cabrillo files from all the SSB logs for all the years for which data are available. Currently, the file covers all the SSB QSOs in the years from 2005 to 2016. The MD5 checksum of this file is: ac555db15417fa76466ed636936e0efe.

I have also created an augmented file, in compressed format, that adds useful data to each QSO. Each QSO line in the augmented file includes an additional four columns, with the following meanings:

  1. The letter "A" or "U" indicating "assisted" or "unassisted"
  2. A four-digit number representing the time if the contact in minutes measured from the start of the contest. (I realise that this can be calculated from the other information on the line, but it saves a lot of time to have the number readily available in the file without having to calculate it each time.)
  3. Band
  4. A set of ten flags, each encoded as T/F: 
    • a. QSO is confirmed by a log from the second party 
    • b. QSO is a reverse bust (i.e., the second party appears to have bust the call of the first party) 
    • c. QSO is an ordinary bust (i.e., the first party appears to have bust the call of the second party) 
    • d. the call of the second party is unique 
    • e. QSO appears to be a NIL 
    • f. QSO is with a station that did not send in a log, but who did make 20 or more QSOs in the contest 
    • g. QSO appears to be a country mult 
    • h. QSO appears to be a zone mult 
    • i. the QSO is a zone bust (i.e., the received zone appears to be a bust)
    • j. the QSO is a reverse zone bust (i.e. the second party appears to have bust the zone of the first party)
The MD5 checksum of this file is: 4acae023af4ea41903249f54446dd79a.
  
Note that the flags in the augmented data are calculated from the raw data independently of the CQ contest committee. This is because:
  1. CQ still does not make the actual scoring code available ;
  2. the checklogs are not public, and hence represent additional data that CQ can use in determining the values of the flags.


2017-01-02

2016 RBN data

All the postings to the Reverse Beacon Network in 2016, along with the postings from prior years, are now available in the directory https://www.adrive.com/public/cQwkEB/rbn.

Some simple annual statistics for the period 2009 to 2016 follow (the 2009 numbers cover only part of that year, as the RBN was instantiated partway through that year).

Total posts:
2009:   5,007,040
2010:  25,116,810
2011:  49,705,539
2012:  71,584,195
2013:  92,875,152
2014:  108,862,505
2015:  116,385,762
2016:  111,027,068
 Total posting stations:
2009: 151
2010: 265
2011: 320
2012: 420
2013: 473
2014: 515
2015: 511
2016: 590
 Total posted callsigns:
2009: 143,724
2010: 266,189
2011: 271,133
2012: 308,010
2013: 353,952
2014: 398,293
2015: 433,197
2016: 375,613
Obviously, statistics that are considerably more comprehensive may be derived rather easily from the files in the directory.

Note that if you intend to use the databaseߴs reported signal strengths in an analysis, you should be sure that you understand the ramifications of what the RBN means by SNR.

2016-07-29

CY9C


Reception of the CY9C DXpedition by the RBN

First, continent-by-continent:


And now the six zones with the largest number of reception reports:

Notes

I was away for most of this DXpedition, and so missed them on 80m, where they would have been a new one. They were audible in the evening on the last two nights, but the QRN level from thunderstorms was very high. They were copyable and worth calling at sunset, but unfortunately both evenings they were QRX for about 20 minutes just at the time of their peak.

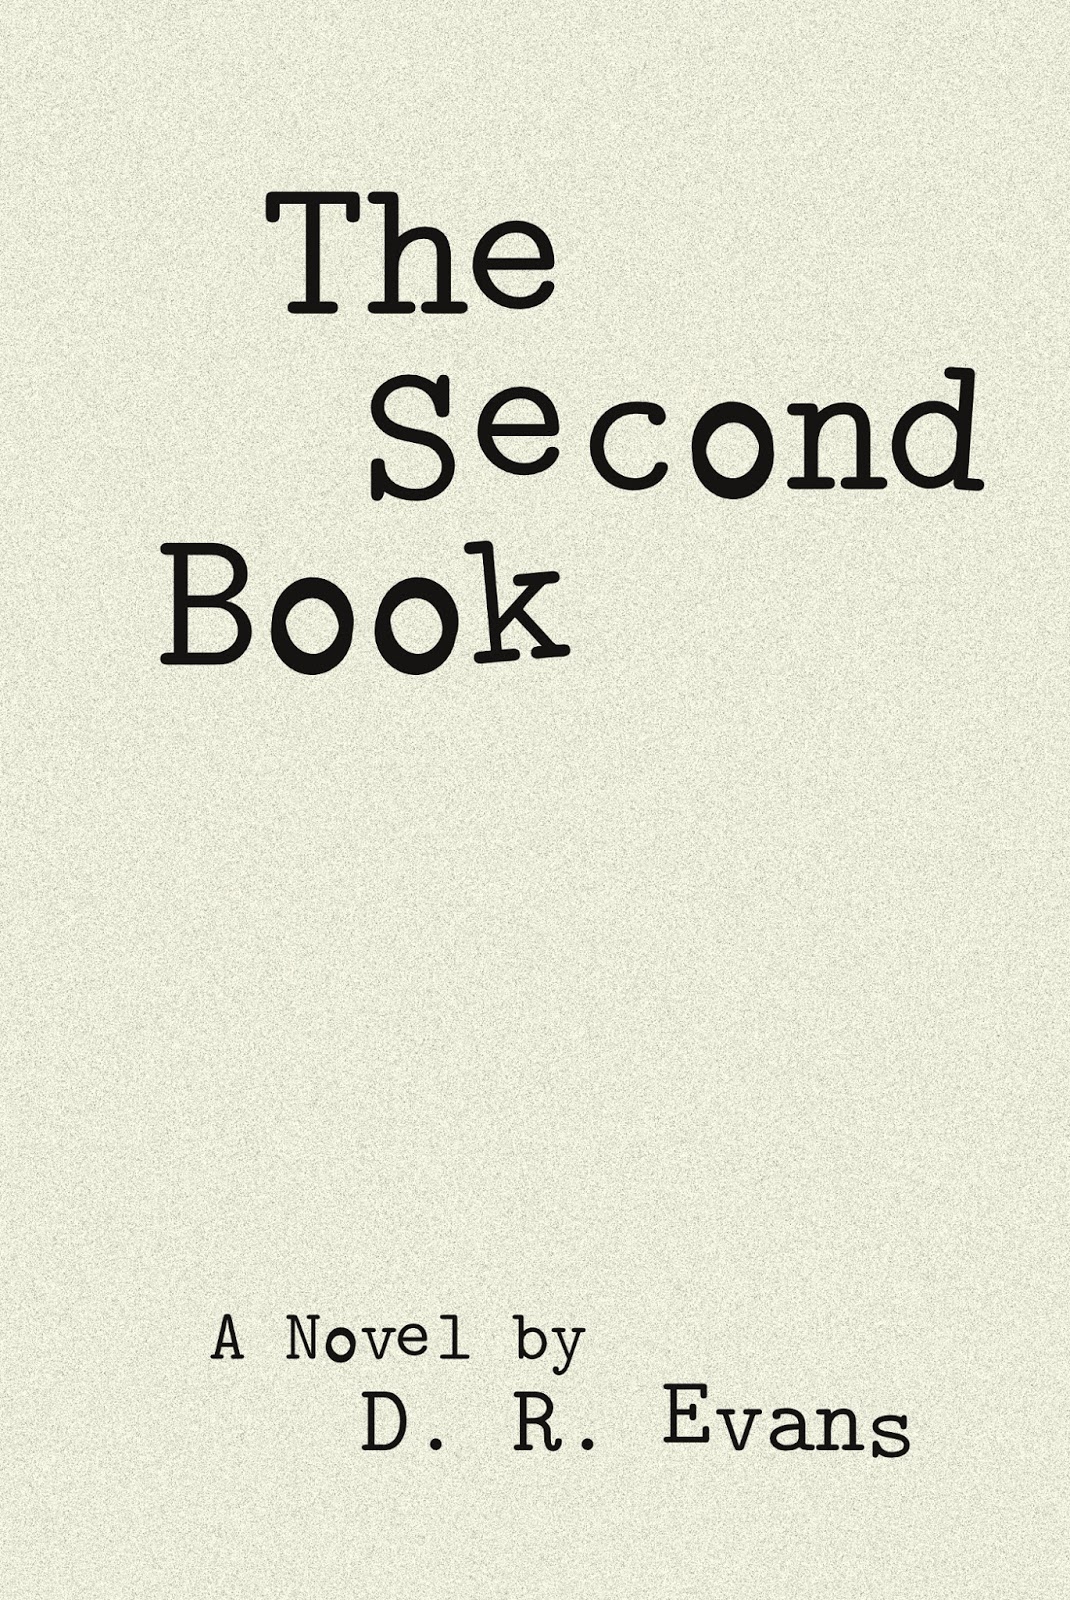
"The Second Book" available in electronic formats


My most recent literary novel, The Second Book, is now available in several electronic formats:
Don't ask me why Apple charges more than the price I set. They seem to do this with all my books.

Most of the above links also allow you to read a sample, typically 10 to 15 percent of the book.

You can, of course, still purchase a print version of the book.

2016-05-07

New augmented logs for CQ WW from 2005 to 2015

I have added two more columns to the flags on each line of the CQ WW augmented logs (the MD5 hash of the file is: 6e8d27f709f13b1851e3bb134592d336).

 The additions to the standard CQ WW Cabrillo QSO line are now (changes in bold):
  1. The letter "A" or "U" indicating "assisted" or "unassisted"
  2. A four-digit number representing the time if the contact in minutes measured from the start of the contest. (I realise that this can be calculated from the other information on the line, but it saves a lot of time to have the number readily available in the file without having to calculate it each time.)
  3. Band
  4. A set of ten flags, each encoded as T/F: 
    • a. QSO is confirmed by a log from the second party 
    • b. QSO is a reverse bust (i.e., the second party appears to have bust the call of the first party) 
    • c. QSO is an ordinary bust (i.e., the first party appears to have bust the call of the second party) 
    • d. the call of the second party is unique 
    • e. QSO appears to be a NIL 
    • f. QSO is with a station that did not send in a log, but who did make 20 or more QSOs in the contest 
    • g. QSO appears to be a country mult 
    • h. QSO appears to be a zone mult 
    • i. the QSO is a zone bust (i.e., the received zone appears to be a bust)
    • j. the QSO is a reverse zone bust (i.e. the second party appears to have bust the zone of the first party)
Note that the encoding of some of the flags requires subjective decisions to be made as to whether the flag should be true or false; consequently, and because CQ has yet to understand the importance of making their scoring code public, the value of a flag for a specific QSO line in some circumstances might not match the value that CQ would assign. (Also, CQ has more data available in the form of check logs, which are not made public.)