2022-01-28

Zone-Based Analyses from 2021 CQ WW SSB and CQ WW CW logs

A large number of analyses can be performed with the various public CQ WW logs (cq-ww-2005--2021-augmented.xz; see here for details of the augmented format) for the period from 2005 to 2020.

As usual, there follow a few analyses that interest me. There is, of course, plenty of scope to use the augmented files for further analyses.

Below are some simple zone-based analyses from the logs.

Zones and Distance


As in prior years, we can examine the distribution of distance for QSOs as a function of zone.

Below is a series of figures showing this distribution integrated over all bands and, separately, band by band for the CQ WW SSB and CQ WW CW contests for 2021.

Each plot shows a colour-coded distribution of the distance of QSOs for each zone, with the data for SSB appearing above the data for CW within each zone.

For every half-QSO in a given zone, the distance of the QSO is calculated; in ths way, the total  number of half-QSOs in bins of width 500 km is accumulated. Once all the QSOs for a particular contest have been binned in this manner, the distribution for each zone is normalised to total 100% and the result coded by colour and plotted. The mean distance for each zone and mode is denoted by a small white rectangle added to the underlying distance distribution.

Only QSOs for which logs have been provided by both parties, and which show no bust of either callsign or zone number are included. Bins coloured black are those for which no QSOs are present at the relevant distance.

The resulting plots are reproduced below. I find that they display in a compact format a wealth of data that is informative and often unexpected.


Zone Pairs


As in prior years, We can examine the number of QSOs for pairs of zones from the 2021 contests using the augmented file.

The procedure is simple. We consider only QSOs that meet the following criteria:
  1. marked as "two-way" QSOs (i.e., both parties submitted a log containing the QSO);
  2. no callsign or zone is bust by either party.

A counter is maintained for every pair of zones (i.e., 1-1, 1-2, 1-3 ... 40-39, 40-40) and the pertinent counter is incremented once for each distinct QSO between stations in those zones.

Separate figures are provided for each band, led by a figure integrating QSOs on all bands. The figures are constructed in such a way as to show the results for both the SSB and CW contests on a single figure. (Any zone pair with no QSOs that meet the above criteria appears in black on the figures.)

It is clear from these figures, as from those for earlier years, that CQ WW is principally a contest for intra-EU QSOs, and secondarily one for QSOs between EU and the East Coast of North America. This format is undoubtedly popular, as CQ WW, in both its SSB and CW incarnations, would seem by any reasonable measure to be the most popular contest of the year. But one does wonder whether there isn't some other format that would more strongly encourage participation from other parts of the world, instead of concentrating activity in these limited areas.


Non-Zero Zone Pairs

The activity between pairs of zones in the CW and SSB CQ WW contests over the period from 2005 to 2021 may be usefully summarised in a single figure:


There are 820 possible zone pairs: (z1, z1), (z1, z2) ... (z1, z40), (z2, z2), (z2, z3) ... (z39, z39), (z39, z40), (z40, z40). The above figure shows the number of different zone pairs actually present in the public logs, for each mode and for each year for which data are available, separated on a band-by-band basis and presented in the form of percentages of the maximum possible count (i.e., 820).

The top two lines require some additional explication: the line marked "MEAN" is the arithmetic mean of the results for the six separate bands for the relevant year and mode. The line marked "ANY" is also constructed from the data for the individual bands, but such that any give zone pair need be present on any one (or more, of course) of the individual bands to be included on the "ANY" line.

Half-QSOs Per Zone for CQ WW CW and SSB, 2005 to 2021

A simple way to display the activity in the CQ WW contests is to count the number of half-QSOs in each zone. Each valid QSO requires the exchange of two zones, so we simply count the total number of times that each zone appears, making sure to include each valid QSO only once.

If we do this for the entire contest without taking the individual bands into account, we obtain this figure:


The plot shows data for both SSB and CW contests over the period from 2005 to 2021. As in earlier posts, I include only QSOs for which both parties submitted a log and neither party bust either the zone or the call of the other party. The black triangles represent contests in which no half-QSOs were made from (or to) a particular zone. By far the most striking feature of this plot is the way in which activity in EU overwhelms that in the rest of the world.

We can, of course, generate equivalent plots on a band-by-band basis:


The activity from zones 14, 15 and 16 so overwhelms these figures that in order to get a feel for the activity elsewhere, we need to move to a logarithmic scale:


The figures speak for themselves.


2022-01-22

Statistics from 2021 CQ WW SSB and CQ WW CW logs

A huge number of analyses can be performed with the various public CQ WW logs (cq-ww-2005--2021-augmented.xz; see here for details of the augmented format) for the period from 2005 to 2021.

As in prior years, there follow a few basic analyses that interest me. There is, of course, plenty of scope to use the log files for further analyses, some of which are suggested by the figures below.

Below are some simple analyses of basic statistics from the logs. The 2021 versions of the contests were, of course, run under the circumstance of the world-wide pandemic, rather similar to the contests in 2020. So we can expect the data for 2021 to be unlike those for any other year except, possibly, 2020. Whether 2020 and 2021 presage changes in any long-term trends will take another a year or two to become clear.


Number of Logs


Until 2020, the raw number of submitted logs for SSB had been relatively flat for several years; the logs submitted for CW showed a fairly steady annual increase. In 2020, unsurprisingly, the number of logs in both modes increased to new records; CQ WW SSB 2021 set another record; on CW, the number of logs decreased slightly, but would still have been a record were it not for 2020 :

One not infrequently reads statements to the effect that the popularity of contests such as CQ WW has long been increasing. This plot suggests that this had not been true for a number of years prior to 2020 (and even when it was true, there are alternative explanations for the year-on-year increase, such as increasing ease of electronic log submission). For the past two years, because of the circumstances of a worldwide pandemic, one would reasonably expect that there really were more people sitting at home and spending at least a portion of the weekend(s) on the air. But, as we see in the next section, that doesn't really seem to have been the case.


Popularity


By definition, popularity requires some measure of people (or, in our case, the simple proxy of callsigns) -- there is no reason to believe, a priori, that the number of received logs as shown above is related in any particular way to the popularity of a contest, despite non-infrequent conclusory statements to the contrary.

So we look at the number of calls in the logs as a function of time, rather than positing any kind of well-defined positively correlated relationship between log submission and popularity (actually, the posts I have seen don't even bother to posit such a relationship: they are silent on the matter, thereby simply seeming to presume that the reader will assume one). 

However, the situation isn't as simple as it might be, because of the presence of busted calls in logs. If a call appears in the logs just once (or some small number of times), it is more likely to be a bust rather an actual participant. Where to set a cut-off a priori in order to discriminate between busts and actual calls is unclear; but we can plot the results of choosing several such values. 

First, for SSB:


Regardless of how many logs a call has to appear in before we regard it as a legitimate callsign, the popularity of CQ WW SSB since the start of the pandemic has surely increased from the doldrums of the prior few years. Whether this contest is more popular than it was at a similar point in the last solar cycle is unclear, but it does seem to have held its own.


[I note that a reasonable argument can be made that the number of uniques will be more or less proportional to the number of QSOs made (I have not tested that hypothesis; I leave it as an exercise for the interested reader to determine whether it is true), but there is no obvious reason why the same would be true for, for example, callsigns that appear in, say, ten or more logs.]

Moving to CW:

Apart from the uptick in 2020, presumably due to the novelty on being forced to remain at home during the pandemic, participation in the CW event seems to be more or less the same as at the corresponding point in the last cycle.


Geographical Participation


How has the geographical distribution of entries changed over time?

Again looking at SSB first:

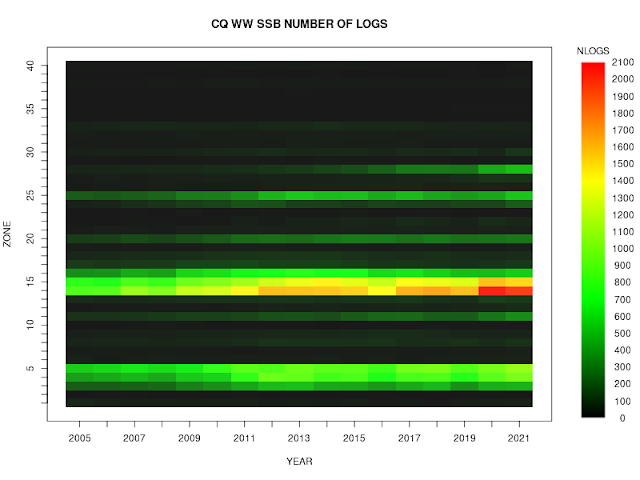
Zone 28 continues to show an increase in the number of logs submitted, to the point where it is now not dissimilar to the number from zone 25. Still, the number of logs from zones outside EU or the US continues to be very small. This can be seen more clearly if we plot the percentage of logs received from each zone as a function of time:

2020 shows a clear increase in western Europe -- the place that already dominated the submissions -- presumably because of the pandemic, and a continuation in Indonesia of the increase that has been ongoing for a number of years now. Of course, this came at the cost of a decrease in other areas, particularly, it seems, Japan. 2021 seems to show that 2020 was an aberration, and, apart from the increase in entrants from zone 28, the geographical areas with the most entrants seem more or less the same as in pre-pandemic years.

On CW, most zones evidence a sustained long-term increase:

And the relative increase seems to be spread more or less evenly across all zones, with the percentages of logs from each zone barely changing over the years 2005 to 2021 (although again what increase there is seems to be most pronounced in western Europe):

It is, I think, of some interest that the change in participation in zone 28 that is obvious on SSB is essentially absent on CW.


Activity


Total activity in a contest depends both on the number of people who participate and on how many QSOs each of those people makes. We can use the public logs to count the total number of distinct QSOs in the logs (that is, each QSO is counted only once, even if both participants have submitted a log).

For SSB:


The total number of distinct QSOs is essentially the same as at the same point in the last solar cycle.

And for CW:

On this mode there continues to be, it seems, a long-lived underlying upward trend (on which the effect of the solar cycle is superimposed), perhaps augmented somewhat by the pandemic in 2020 (but not in 2021 for some reason). Despite the claims I see that CW is an obsolete technology in serious decline, the actual evidence, at least from this, the largest contest of the year, continues to be quite the opposite. (This is a good reminder that when someone makes a claim whose truth is not self-evident, one should examine the underlying data for oneself. I have found that all too often it transpires that no defensible evidence has been put forward for the conclusion being drawn.) The evidence certainly seems to indicate that CW activity is healthy, at least insofar as CQ WW is concerned.

It is worth noting that, during the 2021 running of the SSB contest, it is quite clear that cycle 25 had an impact, whereas a month later on CW conditions had returned to the doldrums.


Running and Calling


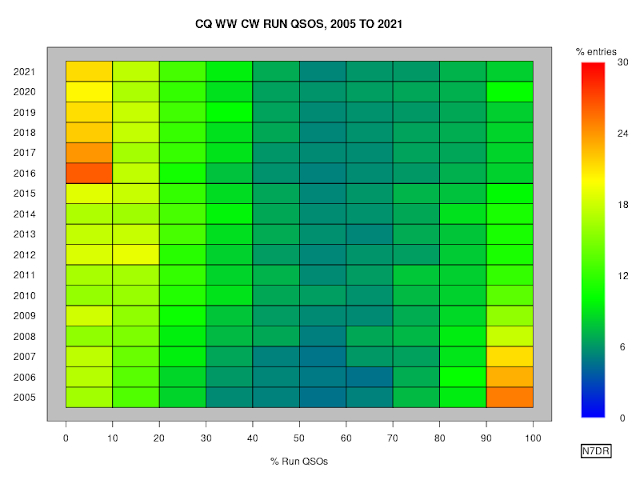
On SSB, the ongoing gradual shift towards stations strongly favouring either running or calling, rather than splitting their effort between the two types of operation, finally appears to have reached some kind of equilibrium, with essentially no change between 2018 and 2019, and even a slight reversal of the trend in 2020 and 2021:


I have not investigated the cause of the decrease in the percentage of stations strongly favouring running, although the public logs could readily be used to distinguish possibilities that spring to mind, such as more SO2R operation, more multi-operator stations, and/or a reluctance of stations to forego the perceived advantages of spots from cluster networks.

On CW, the split between callers and runners continues to be much less bimodal than on SSB (on SSB, fully 30% of entrants have no run QSOs; on CW, the equivalent number is below 10%). Indeed, the difference in call/run behaviour on the two modes (and the difference in the way that the behaviour has changed over time) is profound, and probably worthy of further investigation. CW continues to appear to have what would seem to be a much healthier split between the two operating styles:


Assisted and Unassisted


We can see how the relative popularity of the assisted and unassisted categories has changed since they were introduced:

On CW, there are essentially equal numbers of assisted and unassisted logs, while on SSB the unassisted logs handily exceeds the number of assisted logs. My guess, for what it's worth, is that CW assistance is more widespread partly because it (partially) absolves stations from actually being able to copy at high speed, and partly because the RBN is so effective that essentially all CQing stations are spotted.

I find it particularly interesting that the number of CWU logs has remained essentially unchanged ever since the unassisted category was created.

Looking at the number of QSOs appearing in the unassisted and assisted logs: 

(The lines are for the median number of logs; the vertical bars run from 10% to 90%, 20% to 80%, 30% to 70%, 40% to 80%, with opacity increasing in that order.)


A long-term downward trend in the numbers of QSOs in the assisted logs ceased in 2016, and since then the median number of QSOs in the assisted logs has remained essentially unchanged. A more or less constant difference of roughly one hundred QSOs between the median CW and SSB logs (in favour of CW) continues.

Inter-Zone QSOs


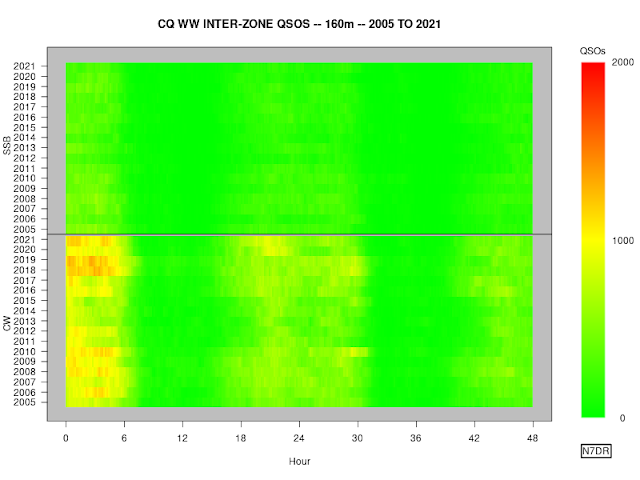
We can show the number of inter-zone QSOs, both band-by-band and in total. In these plots, the number of QSOs is accumulated every ten minutes, so there are six points per hour.

As expected at this point in the cycle, there were a negligible number of QSOs on 10m in the CW event, although there were some on SSB (as is reflected above, in the Activity section). The CW event suffers by a month later in the year. [I do not understand why the CQ WW committee do not alternate the weekends of the SSB and CW modes; but then, I don't understand a lot of what they do or don't do.]

It is clear that in 2021 15m was outstanding for the first day of the SSB event. There were many fewer QSOs on the second day, perhaps at least partly in response to the propagation on 10m, which allowed at least some QSOs on the second day. For the CW contest, it is clear that 2021 simply had poorer conditions than 2020. 2022 is presumably likely to see a return to good conditions on 15m for the CW event; at least one hopes so. 

20m was more or less a repetition of 2020 on both modes.

As usual, CW dominates on 40m The first few hours, which generally dominate the activity for the weekend, in 2021 saw only somewhat more activity than the other two active periods (which correspond to evening in Europe).

80m was also dominated by CW, with, as usual, the bulk of DX activity in the first six hours; indeed, there was relatively little activity at all in the second day of the contest.

160m paints a similar story to 80m, although the raw QSO counts are much lower and the second day is almost devoid of QSOs.

The overall picture shows the influence of the new solar cycle on SSB; but, as noted above, in 2021 CW saw a somewhat of a decrease in inter-zone QSOs as compared to 2020.


2022-01-06

Most-Logged Stations in CQ WW CW and SSB Contests: 2021, and the decade from 2012 to 2021


The public CQ WW CW and SSB logs allow us easily to tabulate the stations that appear in the largest number of entrants' logs. For 2021, the ten stations with the largest number of appearances in CQ WW SSB logs were:

Callsign Appearances % logs
LZ9W 10,680 55
EW5A 10,233 55
YT5A 10,164 54
M6T 10,031 54
PJ2T 9,768 46
ES9C 9,672 54
DF0HQ 9,361 52
A73A 9,329 50
EI7M 9,050 49
CR6K 9,016 49

The first column in the table is the callsign. The second column is the total number of times that the call appears in logs. That is, for example, if a station worked LZ9W on six bands, that will increment the value in the second column of the LZ9W row by six. The third column is the percentage of logs that contain the callsign at least once.

Similarly, the ten stations with the largest number of appearances in CQ WW CW 2021 were:

Callsign Appearances % logs
TK0C 14,707 73
CR3W 12,889 69
CR3DX 11,513 66
LZ9W 11,363 67
M6T 11,055 65
RW0A 11,009 61
PJ2T 10,953 57
PJ4K 10,639 61
YT5A 10,433 64
ES9C 10,303 62

Note the substantial difference between the SSB and CW tables.

I find it interesting to see which stations have had the most long-term activity on the contests. For the ten years from 2012 to 2021 on SSB we find:

Callsign Appearances % logs
LZ9W 91,773 55
DF0HQ 82,643 53
CN3A 75,722 47
PJ2T 69,813 41
K3LR 67,138 45
A73A 64,454 43
P33W 63,731 43
OT5A 63,701 42
HG7T 60,538 43
TM6M 58,986 42

And for the same years on CW:

Callsign Appearances % logs
LZ9W 104,503 66
PJ2T 89,627 51
9A1A 86,922 54
P33W 80,440 52
DF0HQ 78,211 53
W3LPL 71,848 47
ES9C 71,104 46
LZ5R 70,921 53
K3LR 70,279 47
YT5A 69,422 49

2022-01-05

Unofficial Station Reports, CQ WW SSB and CW, 2005 to 2021


Using the public logs, it is rather easy to generate unofficial station-by-station reports for the entrants in the CQ WW contests.

The contest committee generates official reports and generally sends these reports individually to each entrant. But these are typically not made public (although there are some exceptions). The unofficial reports, while not necessarily identical to the official ones, may hold some interest.

The unofficial reports may differ from the official ones because the contest committee has access to checklogs, which are not made public. Also, there are various pathological occurrences in logs that require a decision to be made as to how to classify one or more QSOs; the rules by which such decisions are made are not public, so the decisions that I made when constructing the unofficial reports may well be different from those made by the contest committee. Nevertheless, pathological logs (or pathological QSOs within a log) are relatively rare, so these decisions should affect a relatively small percentage of logs and QSOs. (Typical examples [there are many more] of circumstances in which decisions must made be are: by how much may clocks be skewed and a QSO still be considered valid? what to do if the transmitted callsign changes for some number of QSOs in the contest? what do to if more than one entrant claims to have used the same transmitted callsign?)

The complete set of unofficial reports for the CW and SSB versions of the CQ WW contest for the years 2005 to 2021 may be found in appropriately named files in this directory.

2022-01-03

Cleaned and Augmented Logs (including RBN data) for CQ WW CW and SSB Contests, 2005 to 2021

Cleaned and augmented versions of the logs for the CQ WW CW and SSB contests are now available for the period 2005 to 2021.

Links to the cleaned and augmented logs may be found in this directory (look for "clean" or "augmented" in the filenames).

The cleaned logs are the result of processing the QSO: lines from the entrants' submitted Cabrillo files to ensure that all fields contain valid values and all the data match the format required in the rules. Any line containing illegal data in a field (for example, a zone number greater than 40, or a date/time stamp that is outside the contest period) has simply been removed. Also, only the QSO: lines are retained, so that each line in the file can be processed easily. All zones are rendered with two digits, so as to further simplify processing by scripts or programs.

The augmented logs contain the same information as the cleaned logs, but with the addition of some useful (derived) information on each line. In addition to the actual logs, two additional sources of information are used when appropriate:

  1. AD1C has made accessible historical cty.dat and associated files. These allow us to use callsign-based multiplier lists as they would have existed at the time of each contest.

  2. From 2009 onwards, the Reverse Beacon Network (RBN) has been available for the CW contests. This allows us to include the time since a station was last posted by the RBN (see below for details).

The information added to each line of the augmented logs comprises:
  1. A sequence of four characters that are the same for each entry in a particular log:
    •  a. letter "A" or "U" indicating "assisted" or "unassisted"
    •  b. letter "Q", "L", "H" or "U", indicating respectively QRP, low power, high power or unknown power level
    •  c. letter "S", "M", "C" or "U", indicating respectively a single-operator, multi-operator, checklog or unknown operator category [ the contest organisers have stated that checklogs are not made public, but in fact at least some of them from the early years have been, hence the need for the "C" category ]
    •  d. character "1", "2", "+" or "U", indicating respectively that the number of transmitters is one, two, unlimited or unknown
  2. A four-digit number representing the time if the contact in minutes measured from the start of the contest. (I realise that this can be calculated from the other information on the line, but it saves subsequent script-based processors of the file considerable time to have the number readily available in the file without having to calculate it for each QSO.)
  3. Band
  4. A set of fourteen flags, each -- apart from column k and column n -- encoded as T/F: 
    • a. QSO is confirmed by a log from the second party 
    • b. QSO is a reverse bust (i.e., the second party appears to have bust the call of the first party) 
    • c. QSO is an ordinary bust (i.e., the first party appears to have bust the call of the second party) 
    • d. the call of the second party is unique 
    • e. QSO appears to be a NIL 
    • f. QSO is with a station that did not send in a log, but who did make 20 or more QSOs in the contest 
    • g. QSO appears to be a country mult 
    • h. QSO appears to be a zone mult 
    • i. QSO is a zone bust (i.e., the received zone appears to be a bust)
    • j. QSO is a reverse zone bust (i.e. the second party appears to have bust the zone of the first party)
    • k. This entry has three possible values rather than just T/F:
      • T: QSO appears to be made during a run by the first party
      • F: QSO appears not to be made during a run by the first party
      • U: the run status is unknown because insufficient frequency information is available in the first party's log
    • l. QSO is a dupe
    • m. QSO is a dupe in the second party's log
    • n. RBN information (see below)
  5. If the QSO is a reverse bust, the call logged by the second party; otherwise, the placeholder "-"
  6. If the QSO is an ordinary bust, the correct call that should have been logged by the first party; otherwise, the placeholder "-"
  7. If the QSO is a reverse zone bust, the zone logged by the second party; otherwise, the placeholder "-"
  8.  If the QSO is an ordinary zone bust, the correct zone that should have been logged by the first party; otherwise, the placeholder "-" 

RBN Information


In the CW contests from 2009 onwards, the RBN was active, automatically spotting the frequency at which any station calling CQ was transmitting. To reflect possible use of RBN information, the augmented files now include a fourteenth flag. For the sake of uniformity, this column is present in all the augmented files, regardless of whether the RBN actually contributed useful information to a particular contest.

Each QSO has one of several characters in the fourteenth column of flags. These characters should be interpreted as follows:

'-'
  No useful RBN-derived information is available for this QSO.

'0'
  The worked station (i.e., the second call on the log line) appears to have begun to CQ on this frequency within (roughly) 60 seconds prior to the QSO.

'A' to 'Z'
  For the nth letter of the alphabet: the worked station appears to have been CQing on this frequency for (roughly) n minutes prior to the QSO.

'+'
  The worked station appears to have been CQing for more than 26 minutes on this frequency.

'<'
  Because the the RBN is distributed, and because each contest entrant station has its own clock, there is generally a skew between the reading of the clock of the station making the QSO and the timestamp from the RBN at which it believes a posting was made (indeed, it's unclear from the RBN's [lack of] documentation exactly how the timestamp on an individual RBN posting is to be interpreted). If the character '<' appears in the the RBN column, it indicates that the raw values of the clocks suggest that the QSO took place up to two minutes before the RBN reported the worked station commencing to CQ at this frequency. When this occurs, the most likely interpretation is that there is non-negligible skew between the two clocks, and the station was actually worked almost as soon as a CQ was posted by the RBN. This character also appears if the RBN erroneously posts the worked station as CQing at this frequency shortly after the QSO. But it might also mean that the entrant was simply lucky and found the CQing station just as it fired up on a new frequency.

Notes:
  • The encoding of some of the flags requires subjective decisions to be made as to whether the flag should be true or false; consequently, and because CQ has yet to understand the importance of making their scoring code public, the value of a flag for a specific QSO line in some circumstances might not match the value that CQ would assign. (Also, CQ has more data available in the form of check logs, which are generally not made public.)
  • I made no attempt to deduce or infer the run status of a QSO in the second party's log (if such exists), regardless of the status in the first party's log. This allows one cleanly to perform correct statistical analyses anent the number of QSOs made by running stations merely by excluding QSOs marked with a U in column k.
  • No attempt is made to detect the case in which both participants of a QSO bust the other station's call. This is a problematic situation because of the relatively high probability of a false positive unless both stations accurately log the frequency as opposed to merely the band. (Also, on bands on which split-frequency QSOs are common, the absence of both transmit and receive frequency is a problem; I confess that I have never understood why Cabrillo was not designed to report both transmit and receive frequencies -- or even to define clearly which frequency is to be reported. I digress.) Because of the likelihood of false positives, it seems better, given the presumed rarity of double-bust QSOs, that no attempt be made to mark them.
  • The entries for the zones in the case of zone or reverse zone busts are normalised to two-digit values.

2022-01-02

CQ WW Video Maps: 2005 to 2021


I have updated the set of CQ WW video maps on my youtube channel (channel N7DR). These video maps cover all the years for which public CQ WW logs are currently available (2005 to 2021).

To access individual videos directly:


The videos are created with time steps of ten minutes; when playing the video, each time step is displayed for five seconds. The videos are presented as animated GIF files, so they should display correctly without any specialised video software installed on your computer.

The videos assume that all communication is via the great-circle short path route, and include only inter-zone contacts. The width of the arcs is an absolute measure of the number of QSOs taking place over that path in the particular 10-minute segment. The colour of the arc reflects the relative number of QSOs taking place over the path. Each separate image (i.e., 10-minute segment) is normalized so that the path with the greatest number of QSOs is rendered in white. Paths with fewer QSOs are in progressively darker colours. Thus, arc colour should not be compared from one still image to another; arc width, however, is meaningful. The width of an arc in pixels is one plus the natural logarithm of the number of QSOs represented by the arc.