2023-09-26

Auroral buzz

VA2BBW sent me this file, recorded by him during an SKCC QSO with me on 10m. The QSO took place on 2023-09-25 at 1353z, while Ante was operating as VC3K/VE2 in the SKCC Canadian Straight Key Month event. Normally, 10m is yet to open here at that time, but VA2BBW was a solid S5 here in Colorado, while he gave me an honest 599.

I believe that the QSO was enabled by a burst of auroral activity; the aurora was probably being modulated by the North American electric grid at 60Hz; as we can see from this spectrum plot (taken from the elongated dah in the "d" of "de") the raspy buzz is clearly due to 60Hz modulation.

This is the first time I have heard such a manifestation; normally, auroral QSOs that I have heard display distinct widening of the signal, along with blurring of the individual CW elements as different parts of the auroral region move around at different speeds.

Or to sum it all up in three words: radio is magic.


2023-09-13

Unofficial Station Reports, ARRL DX SSB and CW, 2018 to 2023


Using the public logs, it is rather easy to generate unofficial station-by-station reports for the entrants in the ARRL DX contests.

The ARRL generates official reports and generally makes these reports available individually to each entrant. But these are not made public. The unofficial reports, while not necessarily identical to the official ones, may therefore hold some interest.

The unofficial reports may differ from the official ones because the contest committee has access to checklogs, which are not made public. Also, there are various pathological occurrences in logs that require a decision to be made as to how to classify one or more QSOs; the rules by which such decisions are made are not public, so the decisions that I made when constructing the unofficial reports may well be different from those made by the ARRL. Nevertheless, pathological logs (or pathological QSOs within a log) are relatively rare, so these decisions should affect a relatively small percentage of logs and QSOs. (Typical examples [there are many more] of circumstances in which decisions must made be are: by how much may clocks be skewed and a QSO still be considered valid? what to do if the transmitted callsign changes for some number of QSOs in the contest? what do to if more than one entrant claims to have used the same transmitted callsign?)

The complete set of unofficial reports for the CW and SSB versions of the ARRL DX contest for the years 2018 to 2023 may be found in appropriately named files in this directory.

I note that despite explicitly informing me in 2017 that they would do so, the ARRL have never made public the logs that they hold for the ARRL DX contests for years prior to 2018.

One note regarding interpretation of the information in these unofficial reports: all the fields should be self-explanatory, except that in the listing for EXCHANGE BUSTS, some values are enclosed in parentheses: this indicates that the worked station did not submit a log, and the value of the exchange sent by that station was deduced from QSO: lines in the logs of other entrants.

For example, the report for HL2ZN in the 2021 ARRL DX CW contest contains the line (the line below may be wrapped on your display):

QSO: 14000 CW 2021-02-21 2245 HL2ZN         599 0500   N7DR          599 KY      [ (CO) ]

This indicates that we can deduce that HL2ZN probably bust N7DR's exchange, even though N7DR did not send in a log: HL2ZN recorded N7DR's state as KY, even though N7DR probably sent CO (indeed, I did send CO).

2023-09-12

Cleaned and Augmented Logs for ARRL DX CW and SSB contests, 2018 to 2023


Cleaned Logs


Cleaned logs for the years 2018 to 2023 may be downloaded from this directory. The cleaned logs are combined into a single file; but data for individual stations and years may be extracted trivially from the combined file.

The cleaned logs are the result of processing the QSO: lines from the entrants' submitted Cabrillo files (as [gratuitously] modified by the ARRL) to ensure that all fields contain valid values and all the data match the column-specific standard format for this contest.

Any line containing illegal data in a field has simply been removed. Also, only the QSO: lines are retained, so that each line in the file can be processed easily. All QTH multipliers are rendered as two letters, and the power is rendered as four digits, regardless of how the submitted log recorded these two fields; this should simplify processing the logs by scripts or programs, as should the use of fixed-length records in these cleaned files.

Augmented Logs


Links to augmented logs for the same years may likewise be downloaded from the same directory. The augmented logs are combined into a single file; but data for individual stations and years may be extracted trivially from the combined file.

The augmented logs for the ARRL DX contests contain the same information as the cleaned logs, but with the addition of some useful (derived) information on each line. The information added to each line comprises:
  1. The sequence of four characters that are the same for each entry in a particular log:
    •  a. letter "A" or "U" indicating "assisted" or "unassisted"
    •  b. letter "Q", "L", "H" or "U", indicating respectively QRP, low power, high power or unknown power level
    •  c. letter "S", "M", "C" or "U", indicating respectively a single-operator, multi-operator, checklog or unknown operator category 
    •  d. character "1", "2", "+" or "U", indicating respectively that the number of transmitters is one, two, unlimited or unknown
  2. A four-digit number representing the time if the contact in minutes measured from the start of the contest. (I realise that this can be calculated from the other information on the line, but it saves subsequent processors of the file considerable time to have the number readily available in the file without having to calculate it each time.)
  3. Band
  4. A set of fourteen flags, each -- apart from column k and column n -- encoded as T/F: 
    • a. QSO is confirmed by a log from the second party 
    • b. QSO is a reverse bust (i.e., the second party appears to have bust the call of the first party) 
    • c. QSO is an ordinary bust (i.e., the first party appears to have bust the call of the second party) 
    • d. the call of the second party is unique 
    • e. QSO appears to be a NIL 
    • f. QSO is with a station that did not send in a log, but who did make 20 or more QSOs in the contest 
    • g. QSO appears to be a country mult (may be T for W/VE stations only)
    • h. QSO appears to be a state/province mult (may be T for DX stations only)
    • i. QSO is an exchange bust (i.e., the received exchange appears to be a bust)
    • j. QSO is a reverse exchange bust (i.e. the second party appears to have bust the exchange of the first party)
    • k. This entry has three possible values rather than just T/F:
      • T: QSO appears to be made during a run by the first party
      • F: QSO appears not to be made during a run by the first party
      • U: the run status is unknown because insufficient frequency information is available in the first party's log
    • l. QSO is a dupe
    • m. QSO is a dupe in the second party's log
    • n. RBN information (see below)
  5. If the QSO is a reverse bust, the call logged by the second party; otherwise, the placeholder "-"
  6. If the QSO is an ordinary bust, the correct call that should have been logged by the first party; otherwise, the placeholder "-"
  7. If the QSO is a reverse exchange bust, the exchange logged by the second party; otherwise, the placeholder "-"
  8.  If the QSO is an ordinary exchange bust, the correct exchange that should have been logged by the first party; otherwise, the placeholder "-"

RBN Information


In CW contests from 2009 onwards, the RBN has been active, automatically spotting the frequency at which any station calling CQ was transmitting. To reflect possible use of RBN information, the augmented files include a fourteenth column. For the sake of uniformity, this column is present in all the augmented files, regardless of whether the RBN actually contributed useful information to a particular contest.

Each QSO has one of several characters in the fourteenth column of flags. These characters should be interpreted as follows:

'-'
  No useful RBN-derived information is available for this QSO.

'0'
  The worked station (i.e., the second call on the log line) appears to have begun to CQ on this frequency within (roughly) 60 seconds prior to the QSO.

'A' to 'Z'
  For the nth letter of the alphabet: the worked station appears to have been CQing on this frequency for (roughly) n minutes prior to the QSO.

'+'
  The worked station appears to have been CQing for more than 26 minutes on this frequency.

'<'
  Because the the RBN is distributed, and because each contest entrant station has its own clock, there is generally a skew between the reading of the clock of the station making the QSO and the timestamp from the RBN at which it believes a posting was made (indeed, it's unclear from the RBN's [lack of] documentation exactly how the timestamp on an individual RBN posting is to be interpreted). If the character '<' appears in the the RBN column, it indicates that the raw values of the clocks suggest that the QSO took place up to two minutes before the RBN reported the worked station commencing to CQ at this frequency. When this occurs, the most likely interpretation is that there is non-negligible skew between the two clocks, and the station was actually worked almost as soon as a CQ was posted by the RBN. But it might also mean that the entrant was simply lucky and found the CQing station just as it fired up on a new frequency.

Notes:
  • The encoding of some of the flags requires subjective decisions to be made as to whether the flag should be true or false; consequently, and because the ARRL has yet to understand the importance of making the scoring code public, the value of a flag for a specific QSO line in some circumstances might not match the value that the ARRL has assigned. (Also, the ARRL has additional, non-public, data available.)
  • I made no attempt to deduce or infer the run status of a QSO in the second party's log (if such exists), regardless of the status in the first party's log. This allows one cleanly to perform correct statistical analyses anent the number of QSOs made by running stations merely by excluding QSOs marked with a U in column k.
  • No attempt is made to detect the case in which both participants of a QSO bust the other station's call. This is a problematic situation because of the relatively high probability of a false positive unless both stations log the frequency as opposed to the band. (Also, on bands on which split-frequency QSOs are common, the absence of both transmit and receive frequency is a problem.) Because of the likelihood of false positives, it seems better, given the presumed rarity of double-bust QSOs, that no attempt be made to mark them.
  • The entries for the exchanges in the case of exchange or reverse exchange busts are normalised to two-letter or four-digit values in the same manner as described above for the exchanges in the cleaned logs.

2023-09-11

2023-07-05

2023-07-02

Fixing Problems After Debian Bullseye -> Bookworm

First three items are from upgrade of my shack computer.

Item #4 is from upgrade of my main desktop computer.

Item #5 is from my home server. 

Item #6 occurred on both the main desktop computer and the home server.


Following an error-free upgrade from debian bullseye to bookworm, I encountered the following problems:

1. Problem: The DejaVu Sans Mono font was no longer available.

Solution: I installed the package fonts-dejavu.

2. Problem: Even though the termName was set to xterm-256color in the ~/.Xresources file, the actual value of TERM in an xterm was "xterm".

Solution: Explicitly export TERM=256-color in the ~/.bashrc file. 

Comment: This looks like a bug; setting termName in the resources file has always worked in the past.

3. Problem: core dumps were no longer written to the current working file. (In fact, it wasn't clear where they were being written.)

Solution: Add the line:

kernel.core_pattern = core

to /etc/sysctl.conf.

Comment: I have been using versions of UNIX since the late 1980s. Every single version until debian bookworm would automatically dump core to the current working directory. This seems to be Yet One More example of the madness of systemd taking everything over. Why debian would change the default behaviour of something on which so many people rely seems ridiculous. But then, so did their decision to support systemd.

4. Problem: autotrash has been removed by the upgrade.

The autotrash website says that the script can be installed with:

 pip install --user autotrash

However, that produces:

 [ZB:bin] pip install --user autotrash
error: externally-managed-environment

× This environment is externally managed
╰─> To install Python packages system-wide, try apt install
   python3-xyz, where xyz is the package you are trying to
   install.
    
   If you wish to install a non-Debian-packaged Python package,
   create a virtual environment using python3 -m venv path/to/venv.
   Then use path/to/venv/bin/python and path/to/venv/bin/pip. Make
   sure you have python3-full installed.
    
   If you wish to install a non-Debian packaged Python application,
   it may be easiest to use pipx install xyz, which will manage a
   virtual environment for you. Make sure you have pipx installed.
    
   See /usr/share/doc/python3.11/README.venv for more information.

note: If you believe this is a mistake, please contact your Python installation or OS distribution provider. You can override this, at the risk of breaking your Python installation or OS, by passing --break-system-packages.
hint: See PEP 668 for the detailed specification.
[ZB:bin]

Solution:

Install the python3-full package. Then execute:

[ZB:~] python3 -m venv ~/.venvs/autotrash
[ZB:~] ~/.venvs/autotrash/bin/python -m pip install autotrash
Collecting autotrash
 Downloading autotrash-0.4.5-py3-none-any.whl (22 kB)
Installing collected packages: autotrash
Successfully installed autotrash-0.4.5
[ZB:~]

Now autotrash can be run as:

 ~/.venvs/autotrash/bin/autotrash

5. Problem: no networking.

This computer uses two ethernet ports: one to my ISP and hence to the Internet; one to my home LAN. On completing the upgrade (without error) and rebooting the machine, neither network was functioning.

The networking was originally configured as part of the process of installing stretch on this machine, probably about six years ago; networking has worked flawlessly since then, until this upgrade.

Solution:

The directory /etc/NetworkManager/system-connections directory contains two files, rather oddly called:

  • 'Wired connection enp11s0(eth0).nmconnection'
  • 'Wired connection enp12s0(eth1)'

The contents of these files are:

Wired connection enp11s0(eth0).nmconnection:

[connection]
id=Wired connection enp11s0(eth0)
uuid=8e308949-5232-47aa-b9b6-8aab6369ec4d
type=ethernet
permissions=

[ethernet]
mac-address-blacklist=

[ipv4]
address1=209.97.232.18/24,209.97.232.1
dns=127.0.0.1;209.97.224.2;209.97.224.3;
dns-search=
method=manual

[ipv6]
addr-gen-mode=stable-privacy
dns-search=
method=auto

[proxy]

Wired connection enp12s0(eth1):

[connection]
id=Wired connection enp12s0(eth1)
uuid=251dd901-f8b7-42ee-b568-b15ba565a81b
type=ethernet
permissions=

[ethernet]
mac-address=D8:50:E6:C2:76:03
mac-address-blacklist=

[ipv4]
address1=192.168.0.1/24
dns-search=
method=manual

[ipv6]
addr-gen-mode=stable-privacy
dns-search=
method=auto

The fix is to add a MAC address to the first file.

I note that it is odd that this is necessary: as enp12s0 is mapped directly to a particular port by the MAC address, Network Manager should know that enp11s0 should therefore be mapped to the other port. It has worked that way on this machine since stretch, but apparently this behaviour has changed in bookworm.

It took quite a while to figure this out; more details of the flailing around can be found in the threads that start at:

https://lists.debian.org/debian-user/2023/09/msg00024.html and 

https://lists.debian.org/debian-user/2023/09/msg00061.html.

There is also an official response to the issue at:

https://bugs.debian.org/cgi-bin/bugreport.cgi?bug=1051086,

which I note is remarkably unhelpful (if only because it suggests use of a utility that is not part of debian stable; but it also suggests that the problem is due to kernel timing, which is hard to believe given the discussion in the threads on lists.debian.org -- can a problem that depends on timing of the order of many seconds really be due to a change in kernel timing? -- also, the suggested fix seems less clean than the one I provide above; and, in any case, if a human can figure out which connection goes with which port, Network Manager should have been able to do the same. And Network Manager should in no circumstance have tried to assign two connections to each other, as is described in the first lists.debian.org post; the worst that should have happened is that the connection without a MAC address should have failed, and a useful error message provided).

6. Problem: Errors occur when attempting to connect to remote computers over ssh.

When trying to connect to remote systems over ssh, various error messages would be received. This is a typical such message:

Unable to negotiate with 77.109.148.18 port 22: no matching host key type found. Their offer: ssh-dss,ssh-ed25519

The messages all suggested that ssh was unable to find a common acceptable key type.

It seems that the default types of keys that are deemed acceptable must have changed in bookworm. The easiest fix is simply to restore the old keys types as being acceptable, by adding the following lines to ~/.ssh/config:

PubkeyAcceptedKeyTypes +ssh-rsa
PubkeyAcceptedKeyTypes +ssh-dss

HostKeyAlgorithms +ssh-rsa
HostkeyAlgorithms +ssh-dss


2023-04-28

Reverse NILs in CQ WW: 2022; 2013 to 2022

The basic notion of reverse NILs (rNILs; or, I suppose, RNILs) is described here, along with a description of a simple script for calculating rNILs for CQ WW contests and the result of applying that code to the contests for 2005. See also the comments at the end of that post. I would be delighted if anyone who spots any errors in the script would inform me.

We can also look at the results for periods of ten years at a time; the only difference in the way that these decadal tables are calculated is that the minimum number of rQSOs is raised from 50 to 250 for tables pertaining to all QSOs and from 25 to 125 for those pertaining to intra-W QSOs. (That is, the value of the variable MIN_QSOs is changed from 50 to 250.)

Here are the results for 2022 and for the period from 2013 to 2022. As in prior years, I refrain from comment.

2022 SSB:

Call Total rQSOs Total rNILs
PY2HT 1270 1079
LU9WE 772 559
VA3MLV 487 486
CN3A 13955 272
BY3CQ 1504 267
D4Z 13418 227
K1LZ 7785 174
RT5F 175 174
DJ4DN 289 172
VP2EIH 185 165


Call Total rQSOs Total rNILs % rNILs
VA3MLV 487 486 99.8
RT5F 175 174 99.4
VP2EIH 185 165 89.2
DJ5AM 140 122 87.1
VP9NR 111 95 85.6
PY2HT 1270 1079 85.0
W1ACB 56 42 75.0
LU9WE 772 559 72.4
OE3MDB 211 140 66.4
PD7LJ 198 128 64.6


Call Total rQSOs with Ws rNILs against Ws Total rQSOs with non-Ws rNILs against non-Ws
KV0Q 88 35 594 9
N7DD 52 34 664 15
NY6DX 62 29 1536 28
N2IC 130 24 2360 30
K8LX 29 23 1450 21
K1LZ 403 20 7382 154
K3LR 903 17 7735 86
W7RM 157 17 1943 20
NA6JD 42 15 88 26
KT7E 397 10 1394 10


Call Total rQSOs with Ws Total rNILs against Ws % rNILs against Ws Total rQSOs with non-Ws rNILs against non-Ws % rNILs against non-Ws
K8LX 29 23 79.3 1450 21 1.4
N7DD 52 34 65.4 664 15 2.3
NY6DX 62 29 46.8 1536 28 1.8
KV0Q 88 35 39.8 594 9 1.5
NA6JD 42 15 35.7 88 26 29.5
K5NZ 32 7 21.9 434 6 1.4
N2IC 130 24 18.5 2360 30 1.3
AB3CX 28 5 17.9 2260 17 0.8
W7VJ 34 5 14.7 663 6 0.9
K8GL 41 5 12.2 1401 19 1.4


2022 CW:

Call Total rQSOs Total rNILs
IK3UNA 1329 1048
CS2C 948 905
F6GOE 689 638
DF8AE 652 352
CN3A 14048 197
HF95PRK 249 178
A44A 8591 177
CR3DX 12718 165
V47T 7868 152
EA8RM 8055 151


Call Total rQSOs Total rNILs % rNILs
TG9ADM 62 61 98.4
CS2C 948 905 95.5
F6GOE 689 638 92.6
IK3UNA 1329 1048 78.9
HF95PRK 249 178 71.5
HB9IQB 78 49 62.8
R3QX 85 52 61.2
DF8AE 652 352 54.0
VU2IVV 163 74 45.4
JA1DBG 58 26 44.8


Call Total rQSOs with Ws rNILs against Ws Total rQSOs with non-Ws rNILs against non-Ws
K0RF 280 38 4134 38
W5ZN 70 30 1473 10
NN7CW 172 26 3213 30
K8LX 110 26 3615 30
K1ZM 28 24 215 5
KV2K 43 21 1003 17
K1RX 235 15 5871 50
N7DD 33 14 877 11
K5TR 200 12 3244 44
K3LR 455 11 8038 76


Call Total rQSOs with Ws Total rNILs against Ws % rNILs against Ws Total rQSOs with non-Ws rNILs against non-Ws % rNILs against non-Ws
K1ZM 28 24 85.7 215 5 2.3
KV2K 43 21 48.8 1003 17 1.7
W5ZN 70 30 42.9 1473 10 0.7
N7DD 33 14 42.4 877 11 1.3
K8LX 110 26 23.6 3615 30 0.8
W7RM 52 9 17.3 2641 27 1.0
W4RM 26 4 15.4 1853 27 1.5
NN7CW 172 26 15.1 3213 30 0.9
K0RF 280 38 13.6 4134 38 0.9
W2CG 46 6 13.0 2962 27 0.9


As I write this, the results for the 2022 contests are yet to be announced. I fully expect that, as in years past, that none of the people in the final table of each group whose rNIL rate against Ws exceeds 50% will be disqualified for unsportsmanlike conduct -- or even be investigated in order to determine the reason for what appears on its face to be an excessive rNIL rate against Ws. Year after year, the situation remains the same.

(I do note that rNILs do occur naturally when one of the two operators is a bit sloppy, and a rate that is higher against Ws than against non-Ws could [possibly] be explained as a natural occurrence: for example, the running W operator hears two callers, one W and one DX, and the running station would normally go back to and work the DX station if he can, while the W caller might sloppily believe that he was being worked. What is concerning, though, and should reasonably be a cause for (at a minimum) further investigation, is when the rNIL rate against Ws greatly exceeds the rate against non-Ws, or when the same calls appear in the tables year after year.)

2013 to 2022 SSB:

Call Total rQSOs Total rNILs
EA2DMH 5864 1650
CN3A 81269 1559
LZ9W 93036 1379
PJ2T 72613 1193
JE5JHZ 1603 1185
A73A 57153 1118
PY2HT 3122 1111
YL2014W 1106 1099
MI0M 3870 1085
OT5A 62321 1058


Call Total rQSOs Total rNILs % rNILs
YV4GMG 328 327 99.7
YL2014W 1106 1099 99.4
CU4AT 274 270 98.5
ZZ5Z 297 292 98.3
KP4ROS 667 653 97.9
EA8DDS 503 387 76.9
JE5JHZ 1603 1185 73.9
LU9WE 772 559 72.4
CO2SG 343 232 67.6
OK1KZ 933 599 64.2


Call Total rQSOs with Ws rNILs against Ws Total rQSOs with non-Ws rNILs against non-Ws
N7DD 577 378 8460 161
KV0Q 825 374 7677 116
K3LR 5238 107 62815 758
NY6DX 206 98 6239 101
N2IC 761 95 12809 115
N9RV 728 91 11705 120
K5TR 2982 73 21465 357
K3EST 1494 69 13071 231
W3LPL 2420 66 46188 620
KC1XX 1795 45 42867 622


Call Total rQSOs with Ws Total rNILs against Ws % rNILs against Ws Total rQSOs with non-Ws rNILs against non-Ws % rNILs against non-Ws
N7DD 577 378 65.5 8460 161 1.9
NY6DX 206 98 47.6 6239 101 1.6
KV0Q 825 374 45.3 7677 116 1.5
AB4B 173 23 13.3 7137 98 1.4
N9RV 728 91 12.5 11705 120 1.0
N2IC 761 95 12.5 12809 115 0.9
N3AD 165 20 12.1 9410 148 1.6
N7TU 131 14 10.7 1524 23 1.5
W8PR 248 26 10.5 11862 168 1.4
K3UL 195 19 9.7 10234 182 1.8

CW 2013 to 2022:

Call Total rQSOs Total rNILs
PJ2T 93139 1381
LZ9W 106708 1376
P33W 81257 1140
IK3UNA 12053 1135
9A1A 88591 1052
PJ4A 63571 1040
CS2C 13862 1028
ZF1A 51855 1027
V47T 56107 1016
PI4DX 13591 1009


Call Total rQSOs Total rNILs % rNILs
RA9KY 459 458 99.8
RZ9CJ 462 460 99.6
OK1KZ 1226 993 81.0
WB0CFF 430 313 72.8
CO2IZ 258 178 69.0
F6GOE 1123 640 57.0
AB3UM 276 153 55.4
XF1IM 702 385 54.8
YS1MS 433 232 53.6
PP5BLU 305 148 48.5


Call Total rQSOs with Ws rNILs against Ws Total rQSOs with non-Ws rNILs against non-Ws
N7DD 334 189 7815 153
K0RF 2231 152 33718 402
NR5M 1237 140 15932 152
KV2K 396 129 20213 333
N9RV 679 80 16153 171
NA3M 191 78 11906 98
WJ9B 795 71 12185 109
W3LPL 2674 69 69176 601
K3LR 3245 69 68369 596
NN7CW 901 67 15625 175


Call Total rQSOs with Ws Total rNILs against Ws % rNILs against Ws Total rQSOs with non-Ws rNILs against non-Ws % rNILs against non-Ws
N7DD 334 189 56.6 7815 153 2.0
W1IE 140 62 44.3 3313 136 4.1
NA3M 191 78 40.8 11906 98 0.8
KV2K 396 129 32.6 20213 333 1.6
K8LX 197 54 27.4 7977 84 1.1
NE3F 228 59 25.9 14863 271 1.8
KZ5D 247 58 23.5 10859 138 1.3
W5ZN 212 48 22.6 4476 48 1.1
KV0Q 200 43 21.5 1930 63 3.3
W0QQG 152 28 18.4 1443 216 15.0


2023-04-27

Busting Calls: CQ WW 2022

 Prior posts in this series:

Throughout this post, I apply the procedures developed in the second post above.

For the purpose of this post, only verified QSOs are counted.

Lowest Probability

I begin with an ordered list of the stations with the lowest probabilities of busting a call in 2022 CQ WW SSB.

2022 CQ WW SSB -- weighted mean values of $p_{bust}$ (all)
Position Call weighted mean $Q_v$ $B$
1 OK1WCF 0.0005 1,719 0
2 M3AWD 0.0006 1,506 0
3 PY2KJ 0.0008 1,213 0
4 N2BJ 0.0010 964 0
5 PY5FO 0.0010 926 0
6 G4P 0.0010 909 0
7 I2WIJ 0.0011 882 0
8 W1ARY 0.0012 772 0
9 W6DVS 0.0013 762 0
10 IK1PMR 0.0013 741 0

And for 2022 CQ WW CW:

2022 CQ WW CW -- weighted mean values of $p_{bust}$ (all)
Position Call weighted mean $Q_v$ $B$
1 DL4FN 0.0004 2,040 0
2 SN5J 0.0005 1,722 0
3 DL6NDW 0.0006 1,572 0
4 W3KB 0.0007 1,342 0
5 EU8U 0.0007 1,266 0
6 N3NR 0.0009 1,087 0
7 K1ZZ 0.0009 3,418 2
8 SP9XCN 0.0009 2,155 1
9 K3PH 0.0009 2,142 1
10 M2J 0.0010 992 0

It is interesting to plot the aggregated probability function for $p_{bust}$ weighted by the verified number of QSOs, $Q_v$, for all stations:

In case it isn't clear, the location of the solid vertical lines represent the weighted means of the probability curves.

We can limit the analysis to calling stations (i.e., not the running station).

2022 CQ WW SSB -- weighted mean values of $p_{bust}$ (no-run)
Position Call weighted mean $Q_v$ $B$
1 OK1WCF 0.0006 1,436 0
2 M3AWD 0.0008 1,234 0
3 9A2EU 0.0010 955 0
4 N5RZ 0.0010 954 0
5 N3FJP 0.0010 918 0
6 G4P 0.0011 876 0
7 N2YO 0.0012 793 0
8 I2WIJ 0.0012 791 0
9 W1ARY 0.0013 765 0
10 W6DVS 0.0013 762 0

2022 CQ WW CW -- weighted mean values of $p_{bust}$ (no-run)
Position Call weighted mean $Q_v$ $B$
1 DL4FN 0.0006 1,634 0
2 SN5J 0.0006 1,598 0
3 DK1KC 0.0007 1,428 0
4 DJ5MO 0.0008 1,226 0
5 DL6NDW 0.0008 1,194 0
6 W3KB 0.0008 1,164 0
7 IO1T 0.0008 1,125 0
8 K3PH 0.0009 1,082 0
9 N2RC 0.0009 1,076 0
10 EA2ESB 0.0009 1,053 0

And similarly for running stations.

2022 CQ WW SSB -- weighted mean values of $p_{bust}$ (run)
Position Call weighted mean $Q_v$ $B$
1 PY2KJ 0.0009 1,074 0
2 OH0V 0.0011 884 0
3 VC3R 0.0013 1,499 1
4 5Q2J 0.0014 674 0
5 PY5FO 0.0014 673 0
6 W1GD 0.0017 571 0
7 Z68XX 0.0018 546 0
8 VE3VN 0.0019 1,050 1
9 NT6X 0.0019 500 0
10 K1BX 0.0020 488 0

2022 CQ WW CW -- weighted mean values of $p_{bust}$ (run)
Position Call weighted mean $Q_v$ $B$
1 N2GC 0.0011 886 0
2 EU8U 0.0011 880 0
3 K3WJV 0.0012 802 0
4 K1ZZ 0.0012 2,467 2
5 DL1SAN 0.0012 774 0
6 K1DG 0.0015 2,651 3
7 HG0Y 0.0015 1,979 2
8 K5ZD 0.0017 3,581 5
9 SP9XCN 0.0018 1,118 1
10 DM2M 0.0019 519 0


We can also look at the changes over the period from 2005 to 2022.

First for all QSOs:

Then for calling stations:

And for running stations:

I think it's also interesting to see who appears to have the lowest probability of busting a call over an extended period. So, for the last ten years:

2013--2022 CQ WW SSB -- weighted mean values of $p_{bust}$ (all)
Position Call weighted mean $Q_v$ $B$
1 IK1PMR 0.0005 1,669 0
2 IK4OMU 0.0006 1,501 0
3 RU3SD 0.0007 1,318 0
4 ES2MC 0.0007 2,780 1
5 K4RUM 0.0007 1,267 0
6 K0PC 0.0008 1,217 0
7 NW0M 0.0008 3,649 2
8 LY3CY 0.0008 4,832 3
9 W4EE 0.0008 1,130 0
10 IZ4JMA 0.0008 1,129 0


2013--2022 CQ WW CW -- weighted mean values of $p_{bust}$ (all)
Position Call weighted mean $Q_v$ $B$
1 NW0M 0.0002 3,926 0
2 HL1VAU 0.0002 3,893 0
3 WB4TDH 0.0004 5,406 1
4 K6WSC 0.0004 4,955 1
5 SE6N 0.0004 4,735 1
6 AD1C 0.0004 4,731 1
7 DL4FN 0.0004 9,137 3
8 KM3T 0.0005 1,966 0
9 DP4X 0.0005 4,132 1
10 JA1QOW 0.0005 3,915 1

A good argument can be made that a better measure of copying ability is to consider only run QSOs:

2013--2022 CQ WW SSB -- weighted mean values of $p_{bust}$ (run)
Position Call weighted mean $Q_v$ $B$
1 F4FTA 0.0009 1,108 0
2 N1EU 0.0009 1,013 0
3 R7MM 0.0011 869 0
4 ES2MC 0.0012 1,682 1
5 CF7RR 0.0013 1,557 1
6 DL8RDL 0.0013 734 0
7 EE1A 0.0014 673 0
8 K0AP 0.0014 665 0
9 VA7RR 0.0015 5,494 7
10 DL7URH 0.0016 1,262 1


2013--2022 CQ WW CW -- weighted mean values of $p_{bust}$ (run)
Position Call weighted mean $Q_v$ $B$
1 LY3CY 0.0005 1,717 0
2 RW5CW 0.0006 1,664 0
3 W3OA 0.0006 1,573 0
4 WQ5L 0.0006 1,520 0
5 WB4TDH 0.0007 3,016 1
6 SE6N 0.0007 1,369 0
7 YU1RA 0.0007 2,787 1
8 VX7SZ 0.0007 1,294 0
9 KM3T 0.0008 1,193 0
10 OM7AT 0.0009 1,102 0

Highest Probability

We can also look at the calls associated with the highest probability of busting calls in either the forward or the reverse direction:

2022 SSB -- Most Busts
Position Call QSOs Busts % Busts
1 CN3A 13,659 233 1.7
2 FM5KC 7,324 200 2.7
3 OT5A 7,125 198 2.8
4 K1LZ 7,577 174 2.3
5 PJ2T 10,739 163 1.5
6 CQ8M 4,870 150 3.1
7 CR6K 9,443 149 1.6
8 ZF1A 9,973 143 1.4
9 F6KOP 6,423 140 2.2
10 EA8RM 11,501 139 1.2


2022 CW -- Most Busts
Position Call QSOs Busts % Busts
1 F6KOP 7,534 219 2.9
2 EA8RM 7,981 194 2.4
3 CN3A 13,863 189 1.4
4 TK0C 12,254 188 1.5
5 JA3YBK 5,019 145 2.9
6 A71BX 3,542 144 4.1
7 OT7T 9,500 143 1.5
8 IB1D 2,719 141 5.2
9 LZ9W 11,215 138 1.2
10 PJ2T 11,682 134 1.1


2022 SSB -- Highest Percentage of Busts (≥100 QSOs)
Position Call QSOs Busts % Busts
1 IS0AGY 108 20 18.5
2 YD1CMZ 132 20 15.2
3 VU2OO 165 24 14.5
4 WB7EUJ 161 23 14.3
5 YB1KEL 162 23 14.2
6 VR2UNG 120 17 14.2
7 YB2SPP 102 14 13.7
8 YF1ANL 102 14 13.7
9 W5AAG 126 16 12.7
10 UA3PI 183 21 11.5


2022 CW -- Highest Percentage of Busts (≥100 QSOs)
Position Call QSOs Busts % Busts
1 AI2U 141 34 24.1
2 OK1MKD 110 25 22.7
3 CM3OR 193 41 21.2
4 DL7CO 181 37 20.4
5 JJ5NFT 191 39 20.4
6 K9HXO 215 42 19.5
7 CE6VMO 295 53 18.0
8 JK1CNL 131 22 16.8
9 DL4DRG 146 24 16.4
10 VU2VTI 117 19 16.2


2022 SSB -- Highest Percentage of Reverse Busts (≥100 QSOs)
Position Call QSOs % Reverse Busts
1 NP4WW 147 100.0
2 PT4Z 1,011 20.3
3 TA7YLY 209 18.2
4 9M4BCN 170 17.1
5 BY4DX 918 14.5
6 OZ0JD 459 13.1
7 BD3OD 114 12.3
8 CT2KNA 1,122 10.8
9 YC0BOY 115 10.4
10 BG6HOK 117 10.3


2022 CW -- Highest Percentage of Reverse Busts (≥100 QSOs)
Position Call QSOs % Reverse Busts
1 F5PP 216 19.4
2 N3HEE 340 13.5
3 HB75SG 119 13.4
4 EB7A 6,198 13.1
5 SP2HHX 505 12.7
6 IU2OZV 356 11.8
7 W0GJ 452 11.7
8 K3HW 505 11.3
9 SV0SYH 170 11.2
10 BG3HMQ 117 10.3

In tables of reverse busts, one sometimes finds what seems like an unreasonable number of reverse busts (as is the case, for example, for NP4WW in the 2022 SSB table above). This is generally caused by a discrepancy between the call actually sent by the listed station and the one recorded as being sent in at least some QSOs in the station's log.

2013--2022 SSB -- Most Busts
Position Call QSOs Busts % Busts
1 LZ9W 91,388 1,633 1.8
2 CN3A 79,598 1,437 1.8
3 OT5A 61,077 1,275 2.1
4 PJ2T 71,347 1,261 1.8
5 A73A 55,906 1,080 1.9
6 V26B 54,777 929 1.7
7 YT5A 61,330 895 1.5
8 II2S 48,429 870 1.8
9 ED1R 56,728 837 1.5
10 CR6K 50,573 813 1.6

2013--2022 CW -- Most Busts
Position Call QSOs Busts % Busts
1 LZ9W 104,970 1,176 1.1
2 PJ2T 91,720 1,155 1.3
3 TK0C 73,216 1,092 1.5
4 PI4CC 48,781 970 2.0
5 ZW8T 12,253 881 7.2
6 JA3YBK 48,387 862 1.8
7 RW0A 49,639 830 1.7
8 YT5A 80,598 772 1.0
9 HG7T 68,110 771 1.1
10 VY2TT 46,404 746 1.6


2013--2022 SSB -- Highest Percentage of Busts (≥500 QSOs)
Position Call QSOs Busts % Busts
1 K2JMY 1,632 262 16.1
2 EA7JQT 572 71 12.4
3 JR1MQT 775 89 11.5
4 OH1TS 660 75 11.4
5 EA1HTF 1,762 177 10.0
6 PU2TRX 655 65 9.9
7 EA4GWL 931 91 9.8
8 IS0ILP 553 53 9.6
9 LU4DJB 672 64 9.5
10 YB9KA 706 67 9.5

2013--2022 CW -- Highest Percentage of Busts (≥500 QSOs)
Position Call QSOs Busts % Busts
1 W2UDT 668 148 22.2
2 BD3MV 896 189 21.1
3 4Z5FW 527 108 20.5
4 DJ5UZ 723 136 18.8
5 DL7CO 991 164 16.5
6 WP3Y 570 93 16.3
7 CE6VMO 695 111 16.0
8 AE3D 1,016 161 15.8
9 LZ1BY 789 124 15.7
10 IK0YUO 670 104 15.5

2013--2022 SSB -- Most Reverse Busts
Position Call QSOs Reverse Busts % Reverse Busts
1 DF0HQ 83,594 2,489 3.0
2 JA3YBK 34,097 1,177 3.5
3 CN3A 79,598 1,084 1.4
4 TM3R 24,257 1,049 4.3
5 K3LR 67,007 1,019 1.5
6 CA3CLF 982 915 93.2
7 IK2YCW 25,411 830 3.3
8 GM2T 34,451 781 2.3
9 OT5A 61,077 775 1.3
10 YT5A 61,330 765 1.2

2013--2022 CW -- Most Reverse Busts
Position Call QSOs Reverse Busts % Reverse Busts
1 JS3CTQ 22,376 2,689 12.0
2 DF0HQ 80,316 2,602 3.2
3 ES9C 72,304 2,252 3.1
4 HG7T 68,110 1,572 2.3
5 R2VM 1,426 1,426 100.0
6 W2FU 53,926 1,421 2.6
7 RM9A 63,391 1,399 2.2
8 K3LR 70,698 1,354 1.9
9 YT5A 80,598 1,325 1.6
10 DR4A 52,681 1,273 2.4


2013--2022 SSB -- Highest Percentage of Reverse Busts (≥500 QSOs)
Position Call QSOs % Reverse Busts
1 CA3CLF 982 93.2
2 PT4Z 1,011 20.3
3 ZP6DYA 963 12.1
4 OG60F 4,258 11.4
5 BY4DX 1,269 11.3
6 BH7PCT 846 10.9
7 LU9DDJ 862 10.4
8 BV55D 919 10.2
9 JG3SVP 1,270 10.1
10 DX3EVM 527 10.1

2013--2022 CW -- Highest Percentage of Reverse Busts (≥500 QSOs)
Position Call QSOs % Reverse Busts
1 R2VM 1,426 100.0
2 YT65A 1,149 37.2
3 G3RWF 2,682 35.5
4 5K0A 1,853 32.1
5 PE75W 1,408 29.3
6 OG55W 3,265 28.6
7 TA1C/2 1,513 18.1
8 DP65HSC 516 16.9
9 5J1E 1,523 15.6
10 SB0A 1,102 15.5


2023-03-27

Continent-Based Analyses from 2022 CQ WW SSB and CQ WW CW logs


In addition to zone-based analyses, we can perform similar analyses based on continent rather than zone using the public CQ WW logs (see here for details of the augmented format) for the period from 2005 to 2022.

Continent Pairs


We start by looking at the number of QSOs for pairs of continents from the contests for 2022.

The procedure is simple. We consider only QSOs that meet the following criteria:
  1. marked as "two-way" QSOs (i.e., both parties submitted a log containing the QSO);
  2. no callsign or zone is bust by either party.

A counter is maintained for every possible pair of continents and the pertinent counter is incremented once for each distinct QSO between stations in those continents.

Separate figures are provided below for each band, led by a figure integrating QSOs on all bands. The figures are constructed in such a way as to show the results for both the SSB and CW contests on a single figure. (Any pair of continents with no QSOs that meet the above criteria appears in black on the figures.)


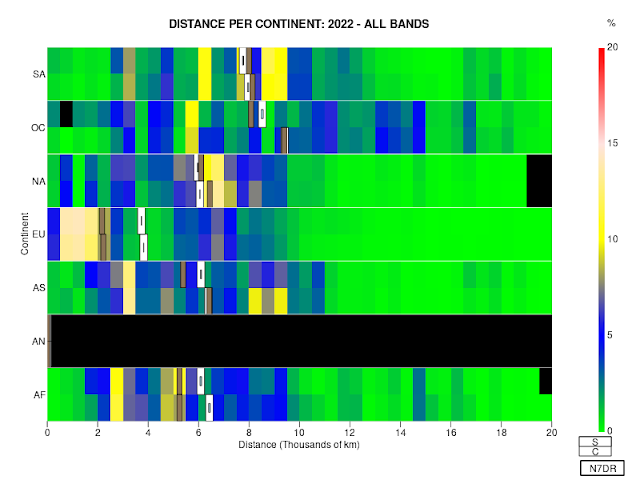
Continents and Distance


Below is a series of figures showing the distribution of distance for QSOs as a function of continent.

Each plot shows a colour-coded distribution of the distance of QSOs for each continent, with the data for SSB appearing above the data for CW within each continent.

For every half-QSO in a given continent, the distance of the QSO is calculated; in this way, the total  number of half-QSOs in bins of width 500 km is accumulated. Once all the QSOs for a particular mode have been binned in this manner, the distribution for each continent is normalised to total 100% and the result coded by colour and plotted. The mean distance for each continent and mode is denoted by a small white rectangle added to the underlying distance distribution. The 99% confidence range of the value of mean is marked by a small blue rectangle (typically entirely subsumed by the white rectangle). The median is marked with a vertical brown rectangle.

As usual, only QSOs for which logs have been provided by both parties, and which show no bust of either callsign or zone number are included. Bins coloured black are those for which no QSOs are present at the relevant distance.

The resulting plots are reproduced below.


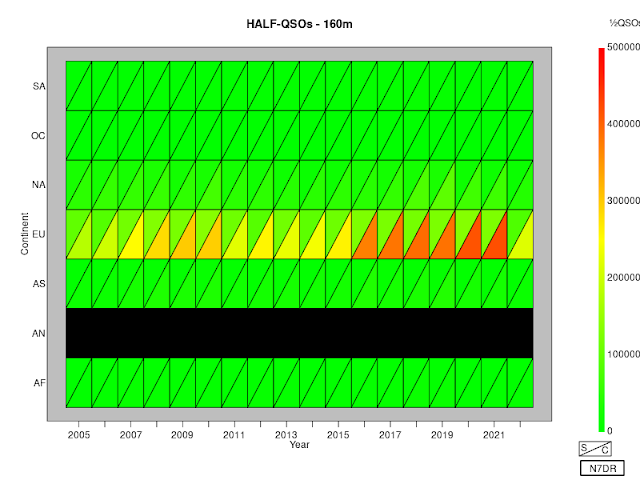
Half-QSOs Per Continent, 2005 to 2022


A simple way to display the activity in the CQ WW contests is to count the number of half-QSOs in each continent (a single QSO contains two half-QSOs, so a single QSO may contain two different continents or the same continent twice). We count half QSOs, making sure to include each valid QSO only once (that is, if the same QSO appears in two submitted logs, it is counted only once).

If we do this for the entire contest without taking the individual bands into account, we obtain this figure:


The plot shows data for both SSB and CW contests over the period from 2005 to 2022. I include only QSOs for which both parties submitted a log and neither party bust either the zone or the call of the other party. The black triangles represent contests in which no half-QSOs were made from (or to) a particular continent. Perhaps more than any other plot, this makes unmistakable the dominance of EU in the CQ WW contests.

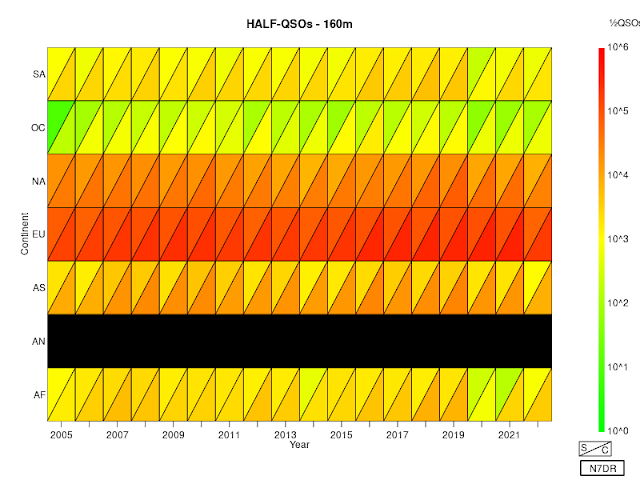
We can, of course, generate equivalent plots on a band-by-band basis:


As in prior years, the activity from EU so overwhelms these figures that in order to get a feel for the activity elsewhere, we need to move to a logarithmic scale:


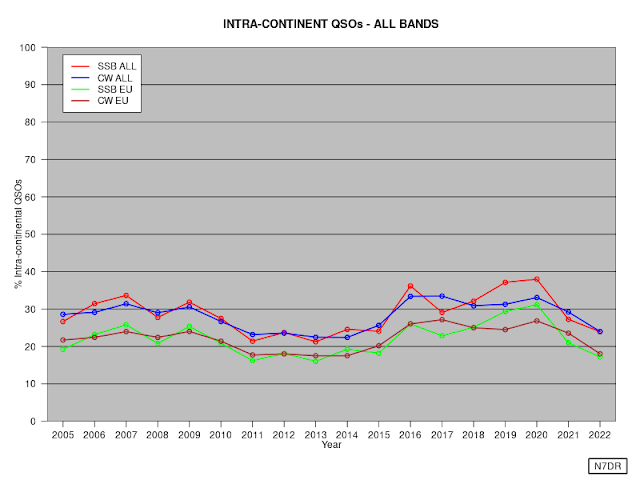
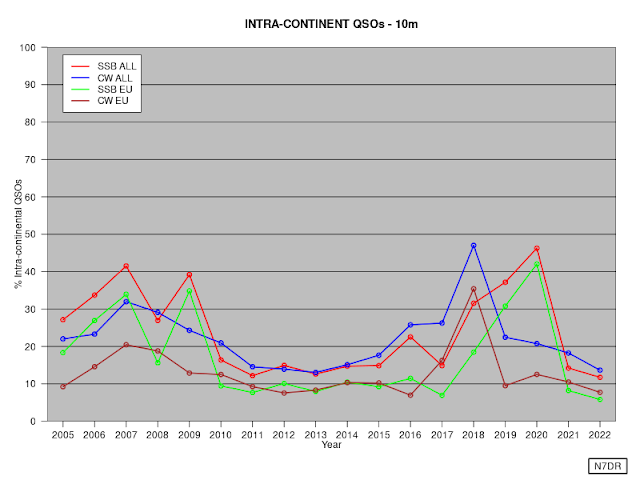
Intra-Continental QSOs


We can also easily look at the percentage of QSOs that are between two stations on the same continent, and in particular between two EU stations:


So, for example, in CQ WW CW in 2022, a quarter of all QSOs were within the same continent; nearly a fifth of all QSOs were between two European stations. This despite much-improved conditions for DX contacts and the near-elimination of the two largest countries in Europe because of the Russian invasion of Ukraine.


Flogging a dead horse, as I do every year, and even in the current year -- a year in which activity from the two largest countries in Europe was greatly diminished -- on 160m more than 60% of QSOs in this "world wide DX" contest were between two European entrants, even in the more DX-friendly mode. On SSB, about three quarters of all QSOs were between two European entrants.